Valmore Rodríguez nació en San Félix, estado falcón, el día 11 de abril de 1900 y muró cincuenta y cinco años después en la población chilena de Quilpué el 10 de julio de 1955. Poeta, narrador, ensayista, periodista, político y parlamentario. Presidente del Congreso Nacional en el período de sesiones de 1948, ejercicio interrumpido por el golpe militar que derroco al Presidente Constitucional Rómulo Gallegos. Sus primeros estudios los realizó en el seno familiar y con un maestro a quien llamaba “el viejo “ Miquelena. De él tomaría como ejemplo el trabajo y el esfuerzo constante para lograr un objetivo.
Siendo aún niño sus padres se mudaron al vecino pueblo zuliano de Quisiro donde viviría unos años para trasladarse posteriormente a la ciudad de Maracaibo. En esta ciudad se empleó en una imprenta donde fue adquiriendo vocación por el ejercicio literario: “ Más ya las letras se lo tenían predestinado – apunta don Rómulo Gallegos en el prólogo a Dos estampas - …no por simple ejercicio de facilidad innata, sino mediante laborioso empleo de adquirir la cultura que la pobreza había querido negarle”…
Tiempo después se vincula a la Iglesia protestante que dirigía en Maracaibo un pastor norteamericano como T.J Bach. Allí realizó sus primeros ejercicios en el periodismo y la escritura más o menos formal al publicar notas sociales, algunos artículos y poemas en la revista evangélica La Estrella de la Mañana; de igual modo en 1918 se publicaron poemas suyos en la revista “Fulgores” de Maracaibo, y el diario Panorama de la misma ciudad. La influencia de mister Bach lo motivó para animarse a viajar a los estados Unidos, país al cual se trasladó el día 9 de julio de 1919, con destino a la ciudad de Nueva York, en compañía de su amigo Alfonso Portillo Gómez. Días más tarde, Panorama publicó un artículo de Valmore pleno de lirismo y nostalgia juvenil que tituló Adiós a Maracaibo, en el cual declara su amor y recuerdo eterno por la ciudad del Lago.
La situación en la norteña nación no era fácil, y menos para un latino recién desembarcado, pues la Primera Guerra Mundial había terminado y miles de soldados se incorporan al campo de trabajo, por tal razón Valmore decide enrolarse en el ejército norteamericano y luego de recibir preparación y entrenamiento por algunos meses, fue asignado a la Zona del canal de Panamá con el grado de sargento. En su nuevo destino tuvo un notable desempeño y, según su amigo y compañero de la juventud el doctor Manuel Matos Romero, dirigió un periódico en idioma inglés destinado a las tropas acantonadas.
En 1921 regresa a Maracaibo y participa en organizaciones espiritistas con tanto fervor que en 1923 interviene en la fundación de la “Sociedad Espiritista de Maracaibo”, en la cual se desempeñó como Presidente, un año después le cambiarían el nombre por “Sociedad Kardesiana de Maracaibo”. Con el tiempo abandonó estas prácticas y se afilió a la logia masónica “Carabobo 69”; el activismo político le sustrajo completamente de esas organizaciones. El 16 de septiembre de 1923 contrajo matrimonio con Doña Elvia Barrera Chirinos, de esta unión nacerían once hijos: Valmore, Mireya, América, Rolando, Samuel, Rosita, Alberto, Rómulo, Tito; Marina y Nora.
Interviene en 1924 en la creación del grupo literario “Seremos”, de gran repercusión en el medio artístico zuliano de la época. En esa aventura de la inteligencia participaron también el pota español Francisco de Rosson, su promotor inicial, Héctor Cuenca, Alonso Pacheco, Aníbal Mestre Fuenmayor, Gabriel Bracho Montiel, Rogelio Illaramendy, José Ramón Pocaterra, Luis Guillermo Govea, Mila Rondón Ríos, Manuel Noriega Trigo, Armando Simons Plumacher, Isidro Valles, Ramón Díaz Sánchez, Angel barroeta, José Antonio Ugas Morán, Ciro nava y otros más. Esta agrupación de corte modernista pretendía renovar el ambiente liteario zuliano, con una manifiesta actitud hacia el compromiso social que fue evolucionando hacia posturas políticas enfrentadas al régimen gomecista.
Paralelamente a esta agrupación, en 1925 se logró constituir en Maracaibo la “Institución Bolivariana”, asociación protectora del empleado presidida por Isidro Valles; esta institución organizó en 1928 el movimiento democrático de apoyo al llamamiento a luchar por la liberación nacional hecho por los estudiantes y el pueblo caraqueño. A pesar de su corta existencia, la organización proyectó un espíritu de lucha y elaboró el primer Código Venezolano del Trabajo. Este Código que abogaba por una serie de reivindicaciones para la masa trabajadora del país, fue remitido al Ministerio de Relaciones Interiores, donde, como era de esperarse, no tuvo respuesta.
Su actividad literaria es de muchos logros durante estos años: participa en concursos, publica un poemario e interviene en las actividades de los “seremistas”, como veremos posteriormente. De igual modo publica una serie de colaboraciones en el recién fundado diario Excelsior de Maracaibo, lamentablemente la colección de este diario correspondiente a 1925 no hemos podido verla.
En Enero de 1928 funda junto a Hector Cuenca el periódico El Nivel, vocero de opinión del cual Cuenca era el editor y Valmore Rodriguez se redactor. El periódico alcanzó buena aceptación y circulación en los medios de oposición al régimen gomecista. Su existencia fue permitida hasta fines de octubre de 1928, cuando fue allanada y destruida la imprenta, por haber manifestado su solidaridad con el discurso contra el analfabetismo que padecía el país, pronunciado por Isidro Valles el 24 de Octubre en la Plaza Urdaneta de Maracaibo.
Valmore Rodriguez fue detenido al igual que otros colaboradores de El Nivel y llevado al Castillo de San Carlos donde permaneció preso durante veinticinco meses. Ya en libertad prefirió marcharse en Barranquilla en compañía de Aníbal Mestre Fuenmayor. En esta ciudad colombiana se unió a los grupos opositores a la dictadura gomecista que fundaron la Agrupación Revolucionaria de Izquierda (ARDI), y en 1931, junto a Rómulo Betancourt, Raúl Leoni, Ricardo Montilla y otros destacados exiliados participó en la elaboración del manifiesto-programa conocido como Plan de Barranquilla, destinado a crear una conciencia política en el seno del pueblo venezolano y definiciones ideológicas en los grupos de vanguardia que liderizaban la lucha antigomecista.
Regresa al país en 1943 para trabajar en las compañías petroleras de Lagunillas. Este contacto con los obreros petroleros le proporcionó conocimientos directo sobre las condiciones laborales y la necesidad de emprender las luchas gremiales para el mejoramiento de esas condiciones que por lo demás eran sumamente injustas e inhumanas. Con tal propósito dedica grandes esfuerzos y las mejores energías de su vida al trabajo subterráneo por organizar el movimiento sindical en el Zulia, logrando fundar el Sindicato de Obreros y Empleados Petroleros de Cabimas (SOEP), que funcionaba clandestinamente. Muerto el General Gómez, Valmore se traslada a caracas en enero de 1936 a gestionar la legalización de los sindicatos petroleros; al llegar a la capital fue detenido y trasladado a la cárcel de La Rotunda, donde permaneció detenido hasta el 16 de febrero de ese año, cuando fue liberado gracias a la presión del movimiento popular.
El SOEP, presidido por Valmore Rodríguez desde su fundación, finalmente fue legalizado en acto público celebrado el 27 de febrero de 1936 en el Teatro Variedades de Cabimas. Entra entonces a dirigirlo Hermes Coello León, y Valmore se dedica a fundar los sindicatos de Lagunillas, Mene Grande, San Lorenzo, Mene Mauroa y Maracaibo, donde sus partidarios, llamados Azules, se disputaban con los comunistas, apodados Rojos, el control de estas organizaciones obreras. Al lado de Valmore rodriguez cumplieron un importante papel en la organización de estos movimientos sindicales algunos anarquistas españoles que se habían radicado en esta zona del país como José Peris y María y José Fernández. Meses después, dice Valmore en un artículo publicado en Orve, en relación a la conquista del trabajador petrolero:…”el obrero explotado de las petroleras no tiene otro recurso ni otra arma que su sindicato. Allí está su más preciosa y única conquista. Que a él ha de servirle de instrumento para elevarse al nivel humano que de derecho le corresponde…”
Desde los primeros días de 1935 se ocupó de la organización de la corresponsalía de Cabimas de Panorama en Cabimas, cuya Agencia Central fue inaugurada el 3 de marzo del mismo año por el Director del diario. Esta oficina se quedó a su cargo hasta el 20 de marzo de 1936 cuando asume la responsabilidad de Jefe de Redacción del citado diario. El 11 de abril de 1936 se encargó de la Dirección de Panorama, por ausencia de su titular y dueño, don Ramón Villasmil, quien asistía como parlamentario a las sesiones del Congreso de la República. Su creciente participación política y diversas obligaciones lo llevaron a renunciar al cargo de Jefe de Redacción encargado del diario marabino el 6 de junio de ese año.
Con el advenimiento del General López Contreras, Valmore participa activamente en el Zulia en la formación de Comités de Defensa de la Democracia, un poco con la idea de impedir que el nuevo gobierno pudiera continuar la política del antiguo régimen.
Los nuevos tiempos se iniciaron en Venezuela con la llegada del año 36, sirvieron para crear en el país numerosas organizaciones políticas. En el Estado Zulia Valmore Rodríguez y otros luchadores democráticos fundaron el Bloque Nacional Democrático (BND), el cual “viene a formar – expresan en un manifiesto el 26 de marzo de 1936 – el partido necesario para la defensa de la República, y porque cree que ella no ha de reducirse al mero cambio de unos hombres por otros, con la vigencia del mismo régimen y de iguales procedimientos, dirigirá sus actividades en un sentido que permita la realización de una nueva estructuración política, social, económica del país”. En relación al programa político lo califican como un programa revolucionario ajustado a los ideales democráticos del pueblo. El B.N.D. contribuyó notablemente con la formación de un espíritu democrático en la región zuliana, y sirvió de base para la integración del futuro P.N.D.
De marzo a diciembre de 1936 el Bloque Nacional Democrático desarrolló jornadas de gran agitación en el Zulia. Los mítines se sucedían en Maracaibo, Cabimas, Lagunillas, Santa Rita, Puertos de Altagracia, etc., primero en trabajo de propaganda y captación de adeptos para el partido, y después contra la Ley y en la preparación de la huelga petrolera de diciembre.
El Comité Directivo del Bloque Nacional Democrático estuvo integrado de la siguiente manera: Secretario Político: Valmore Rodríguez; Secretario de Organización: Felipa Hernández; Secretario de Propaganda: Isidro Valles; Secretario de Economía: Rafael Echeverría G.; Comisiones: Política: Dr. Manuel Matos Romero y Armando Hernández Bretón; Organización Interna: Elio Montiel y María Teresa Contreras; Organización Gremial: Eduardo Arcila Farías, Olga Luzardo y Espartaco González; Propaganda: Ciro Urdaneta Bravo y Amílcar Inciarte; Economía: Jesús Leopoldo Sánchez y Dr. ALonzo Briceño: El partido editó un periódico que bautizaron: Frente Nuevo, Órgano del Frente Nacional Democrático, en el mismo figuraba como Director Ciro Urdaneta Bravo y Administrador Rafael Echeverría G. El 30 de Octubre de 1936 el B.N.D. quedó adscrito en su totalidad al Partido Democrático Nacional (P.N.D.), integrándose en Comité Directivo Estadal con Valmore Rodríguez como Secretario General.
Al frente de todo este movimiento siempre apareció Valmore Rodríguez como orador en varias concentraciones populares y como editorialista de Ondas del Lago, y también como Director encargado del diario El País de Maracaibo, en sustitución de Felipe Hernández, quien se encontraba preso desde los primeros días de septiembre.
Días antes de la huelga petrolera, 9 de diciembre de 1936, Valmore es detenido y enviado a presión para impedir su participación en el conflicto; le hacen compañía Isidro Valles, Aníbal Mestre Fuenmayor, Rodolfo Quintero y Felipe Hernández. En marzo de 1937 es expulsado del país hacia México junto a cuarenta y seis compatriotas acusados de desarrollar actividades comunistas.
Valmore viaja de México a Colombia y se traslada clandestinamente a Maracaibo donde permanece “enconchado” unos meses para incorporarse de nuevo al trabajo político del P.N.D y al periodismo. Esta vez con el seudónimo de Juan Lucerna escribió la columna “Escolios” en el diario Panorama desde el 28 de octubre de 1939 hasta el 1ro. De mayo de 1941. Durante estos diecinueve meses publicó diariamente la citada columna, la cual adquirió tanta importancia por aquella época en la ciudad de Maracaibo, que muchos conocidos periodistas se atribuían descaradamente su autoría, de igual modo se desempeñaba como editorialista en la emisora marabinas Ondas del Lago y Radiodifusora Maracaibo, verdaderos voceros de orientación popular.
A partir de estos años, su apasionamiento por el periodismo se manifiesta en el trabajo incesante de la prédica dirigida a la formación de una conciencia revolucionaria en el pueblo que lentamente comprendía la importancia de darse sus propias organizaciones políticas y sindicales. Con este ánimo escribe entre el 5 de Octubre de 1940 y el 26 de Junio de 1942 en el semanario Fantoches de caracas la columna “En este país”…, que firma como Tito Rosales. En dicha columna va perfilando una posición crítica y de oposición al gobierno del general Isaías Medina Angarita y de vocero de la tesis del P.N.D., y más tarde del recién fundado partido Acción Democrática, partido en el cual entra a militar y del que llegaría a ser Presidente.
En el diario Ahora de Caracas mantuvo en los meses de abril y mayo de 1941 la columna “Réplicas” que firmaba con su propio nombre. Esta columna como casi todas las suyas se ocupaba del tema de las luchas sociales y los reclamos populares cotidianos. Meses después en el diario El Heraldo de Caracas inició su columna “Contrastes” con el seudónimo de Telémaco, la misma se mantuvo casi diariamente desde el 2 de Enero hasta el 3 de marzo de 1942 en la edición de la mañana, a partir de esa fecha su publicación continuó en la edición vespertina del mismo diario hasta el 1ro de Octubre del 43, para continuar publicándola en El País.
El nuevo partido Acción Democrática lo designa integrante de la Comisión Responsable de la Redacción de: AD: Semanario del Partido Acción Democrática, cargo que desempeña junto a Juan Oropeza y Luis Troconis Guerrero desde el Nº1 que aparece el 10 de enero de 1942 hasta el Nº 82 del 21 de agosto de 1943, cuando se ausenta por enfermedad y viaja al interior del país , según informa un suelto del Nº 83 del citado Semanario.
Sin embargo, su mayor y más querida realización fue la fundación de El País de Caracas, periódico que dirigió desde su aparición el 11 de enero de 1944, editado por la “Editorial Avance” de la cual era presidente. En este diario se ocupó de la línea editorial durante el tiempo que permaneció como Director, lo cual compagina perfectamente con su recia personalidad y seriedad política, reconocida y respetada por todos sus copartidarios, empezando por el mismo Rómulo Betancourt. La autoría de tales editoriales en ningún momento nos ha merecido duda, de acuerdo a la información ofrecida por testigos de excepción como el Dr. Luis Beltrán Prieto Figueroa. Otro tanto puede decirse de los editoriales del diario “Panorama”, aparecidos durante su permanencia como director encargado del mismo.
Además de la columna” Contrastes”, Valmore publicó en El Pías una nueva denominada “El Mirador de Próspero”, firmada con el seudónimo de Próspero, pero ocurrió que tal columna tomó un carácter colectivo, pues en ella escribían, entre otros, Rómulo Betancourt y Luis Troconis Guerrero, Jefe de Redacción del diario.
En mayo de 1945 fue invitado a visitar a Inglaterra por el ministerio de información de Guerra de ese país. La gira a la cual también estuvieron invitados otros periodistas latinoamericanos, la realizó en compañía de Miguel Otero Silva de El Nacional y Marco Aurelio Rodríguez de La Esfera. En Londres se entrevisto con el Mayor Clement Atlee, líder laborista y otros personeros del gobierno inglés; visitaron instalaciones industriales, plantas de guerra y conocieron el esfuerzo hecho por Gran Bretaña para enfrentar el nazismo.
Abandonó la Dirección de El País el 20 de octubre de 1945 para encargarse del Ministerio de Relaciones Interiores de la Junta Revolucionaria de Gobierno, este cargo permaneció hasta fines de marzo de 1946. El 4 de abril de ese año fue nombrado Ministro de Comunicaciones ; entre las realizaciones que llevó adelante en este Ministerios está la creación de la Flota Mercante Gran Colombia . Dejo el Despacho de Comunicación el 25 de marzo de 1947. Valmore viajó de vacaciones a la Habana entre el 30 de marzo y el 25 de abril de 1947, no sin antes rendir las respectiva declaración de bienes que alcanzó a la suma a de 18 mil 76 bolívares con 58 céntimos. Al regresar a Caracas fue electo Presidente de la VII convención Extraordinaria de Acción Democrática que se instalo el 30 de junio de 1947 en el teatro Coliseo.
Valmore Rodríguez resultó electo en 1944 Concejal del Distrito Federal por la Pastora, parroquia donde vivía; en 1947 el electorado del Estado Falcón lo favorece con el voto para elevarlo a la condición de Senador. En la sesiones parlamentarias de 1948 lo eligen presidente de la Cámara del Senado, y como tal presidente de un congreso de la República, convirtiéndose en el primer Presidente de un Congreso nombrado por el voto universal, directo y secreto de sus ciudadanos. En el discurso de toma de posesión en honor que le conferían y apuntó además:… “la intima satisfacción de estar contemplando, desde el más alto sital del Senado de la República, cómo se hace carne de realidad el anhelo secular de nuestro pueblo, en la viva representación de su voluntad soberana”… expresa se recuerdo para todos los luchadores por nuestra constitucionalidad, desde Vargas, “hasta el último ciudadano humilde asesinado en La Rutunda, en San Carlos, Puesto Cabello o Palanque por el último esbirro de instintos primitivos que arman con pica de autoridad el dictador de turno”… Como presidente del Congreso le cupo el honor de tomar juramento en febrero de 1948 a don Rómulo Gallegos, Presidente Constitucional de Venezuela.
Depuesto el Presidente Gallegos tras el golpe militar del 24 de noviembre de 1948, Valmore Rodríguez se trasladó en ejercicio provisional de la primera magistratura mientras durase la detención del Presidente Constitucional. Formó gabinete, nombró jefes de la Fuerzas Armadas y dirigió un mensaje a la Nación invocando la lealtad y el respeto a la Constitución de la Institución armada. Convencido de si inútil esfuerzo se entregó a los militares golpistas. Preso en la Cárcel Modelo de Caracas, sufrió durante diez meses las pésimas condiciones del cautiverio que le provocaron los infartos sin recibir la debida atención médica. La presión ejercida por su partido y los demócratas del continente logró rescatarlo y en septiembre de 1949 es enviado a su tercer y último exilio.
Radicado en la ciudad de Nueva York, pudo hacer realidad una de sus secretas ilusiones: de manera admirable y muy propia de tenacidad se dedicó a estudiar la educación secundaria norteamericana (High School), hasta presentar el último examen el 21 de octubre de 1952, el mismo día que la policía pérezjimenista asesinaba en las calles de Caracas a Leonardo Ruiz Pineda, y empezó a asistir a los cursos de economía en la Universidad de Columbia. De igual modo se dedicaba a hacer traducciones para la revista Selecciones del Read´s Digest y entre diciembre de 1953 y abril de 1954 publicó una serie de crónicas en el diario La Esfera de Caracas, firmabas con el seudónimo de José Robles. De esta época datan varios trabajos de tipo político y de denuncia de la represión desatada por la dictadura de Pérez Jiménez, así como documentos dirigidos a la sociedad Internacional de Prensa, llamando la atención sobre las condiciones de la censura a los medios de comunicación imperante en su patria.
Entre su actividad literaria destaca, además de la fundación del grupo literario “Seremos” en 1924, la participación en diciembre de ese mismo año en los Juegos Florales de Cumaná, organizados por la “Sociedad Patriótica Ayacucho” para celebrar el centenario de la Batalla de Ayacucho, en este certamen obtuvo el primer premio con su poema Canto a la Batalla de Ayacucho,… “mérito de triunfo bien disputado –dice don Rómulo Gallegos en el prólogo citado_ que le acredita la circunstancia de que en ese concurso haya obtenido el accésit el gran poeta zuliano Udón Pérez”… En 1928 su poema La epopeya del trabajo, obtiene el primer premio en el concurso promovido en la ciudad argentina de Bolívar, organizado para conmemorar el cincuentenario de dicha ciudad. Un nuevo galardón literario le fue conferido al otorgarle el primer premio en el concurso de cuentos del diario Panorama e 1934 con la narración El mayor, y el segundo premio del concurso nacional de cuentos del semanario Fantoches en 1942, con La Capitana.
De su obra publicada mencionaremos: Los caminos inefables (poemas).- Maracaibo: Tipografía Excelsior, 1925.136 p. (prólogo de Héctor Cuenca); Dos estampas: El mayor; La Capitana.- Caracas Editorial “Magisterio”, 1942, 32p. (Prólogo de Rómulo Gallegos); Bayoneta Sobre Venezuela._ México: Editores e Impresores Beatriz de Silva, 1950. 150p (prólogo de Alberto Carnevali ). Inédito se encuentra varios capítulos de su novela Las candelas del Diablo y parte de una novela a la que no puso titulo. Otros cuentos y poemas dispersos en la prensa nacional se incluirán en el volumen correspondiente a literatura en sus Escritos de Época De Nueva York, Valmore Rodríguez se trasladó con su familia a Chile, allí le sobrevino la muerte en la población de Quilpué el 10 de julio de 1955. Presintiendo lo peor, Valmore siempre manifestó que si moría, sus restos sólo fueran trasladados a Venezuela cuando un gobierno democrático mandara en el país, lo cual se llevo a cabo el 10 de julio de 1959 en medio de una imponente ceremonia.
El viejo Valmore: Conciencia vigilante Valmore Rodríguez puede ser definido como una conciencia vigilante de su tiempo, como un hombre político. Su actividad intelectual y de luchador social se mantuvo en estas dos constante de su vida a través de su trabajo como poeta, narrador y abanderado de los cambios sociales. Es esta última actividad y en su infatigable pasión periodística, donde su nombre adquirió relevancia para la historia contemporánea venezolana, como claro exponente de la férrea combatividad de su generación por imponerse a las circunstancias de la Venezuela que les tocó vivir.
El “viejo” Valmore, como cariñosamente lo llamaban sus amigos y partidarios, o, el señor Rodríguez, como de manera despectiva de referían a él los sectores reaccionarios, fue un verdadero líder popular de limpia y noble personalidad que hizo de las mejores causas populares una pasión inseparables de su condición humana. Con altura, decencia política y su magnífica garra de polemista supo defender su honor de las innumerables injurias y calumnias que con sorprendente constancia le lanzaban el enemigo. Tal era el odio que en El Heraldo de Caracas del 15 de julio de 1950, un oscuro articulista lo llamaba: “el mas odioso personaje del fenecido régimen sectario”, y de su dolencia cardíacas, que lo mantuvieron al borde de la muerte en la Cárcel Modelo, dice: “supuesta gravedad con que especuló su partido para sorprender los reconocidos sentimientos humanitarios del Gobierno Nacional”. Solo la mezquina pequeñez puede juzgar así a un hombre hecho para el servicio de su pueblo y de su patria, sin detenerse a analizar que ciertas actitudes eran un mandato para clarificar y defender la dignidad de los venezolanos. Quizá esto lo llevó a acuñar la frase: “Dividirse es ubicarse”, situarse junto a la causa por la quien se ha batallado toda una vida.
La formación intelectual y política adquirida por Valmore Rodríguez en largos años de lecturas y confrontación de opiniones, se ven cristalizados en la redacción del Programa de Bloque Nacional Democrático (BND), partido que fundara en marzo de 1936; allí expresaba: “El interés de las mayorías será nuestro interés, y por ello reservamos a la clase trabajadora la dirección en el combate por las libertades democráticas”.
Estas libertades serían el resultado de la lucha, entre otros aspectos, por: “efectividad de las garantías constitucionales; Defensa de la autonomía regional, de Municipio, de los Estados (Derecho indelegable a elegir sus presidentes); Efectividad de la autonomía del poder judicial; Ley nacional de elecciones por el sistema de la representatividad proporcional; Leyes protectoras de la industria y el comercio, cancelación de los monopolios; Nacionalización y municipalización de los servicios públicos: teléfonos, electricidad, ferrocarriles, etc; Restitución de sus tierras al indio; Liberación de los indios que trabajan en nuestros campos, esclavizados por contratos unilaterales”, etc.
La vida de Valmore Rodríguez constituyó un buen ejemplo de perseverancia revolucionaria, de superación constante para vencer un medio hostil a toda idea creadora o de cambio, como el imperante en la Venezuela gomecista. A pesar de la madurez que traen los años y el endurecimiento propio de la lucha, nunca perdió el candor romántico de su gesto “seremista” del año 24; sus narraciones inéditas nos presentan a un hombre ganado para la literatura, quien de haber desarrollado esta innata condición hoy sería uno de los grandes escritores nacionales.
La obra de Valmore Rodríguez, por razones de su activismo político, está dispersa en la prensa venezolana e internacional. Fue este medio de comunicación el mejor instrumento para propagar sus ideas y llevar orientación al pueblo trabajador, a partir de 1928 en el Zulia y años después en Caracas. Esta pasión verdadera y determinante en su vida se vio disminuida durante sus varios exilios, pero nunca abandonada pues en aquellos años se publicaron en Barranquilla, Nueva York y Santiago de Chile, artículos suyos.
La azarosa vida de organizador del movimiento obrero y dirigente popular en la Venezuela que nace a la democracia al finalizar la traumática dictadura gomecista, no le posibilitó la producción de una obra más acabada y sistemática como tantas veces lo expresó a sus allegados. Buena parte de sus artículos muestran de manera fragmentaria, ráfagas de un pensamiento lúdico y progresista que desarrollado y profundizado, seguramente se habría adelantado en muchos años y en aportes para la comprensión del período que va de 1936 a 1948, rico en sucesos y en implicaciones históricas. Aún así, esta serie de trabajos reunidos en sus Escritos de Épocas, facilitará a ñps centros de investigación, estudiantes y aficionados en general, abordar de manera directa a un participante de esa historia que tanto entusiasma y motiva por lo relativamente reciente y por la influencia que pudiera tener en el proceso democrático de nuestros días.
Consciente del valor que esta obra tiene para las nuevas generaciones de venezolanos, la Cámara del Senado acordó dar cumplimiento a la decisión de publicar sus escritos políticos y literarios. Para llevar a cabo tal acuerdo, el doctor Reynaldo Leandro Mora, Presidente del Congreso de la República, nombró una Comisión Especial integrada por los Senadores Juan Páez Ávila, quien la preside, Luis Vera Gómez y Rubén Carpio Castillo con el fin de lograr este cometido que hoy se hace realidad.
Organización de la Obray del Blog Hemos considerado conveniente darle una organización a los materiales que integran estos Escritos de Época, de modo que el contenido de la misma guarde una cierta coherencia para el lector quien así podrá obtener una visión de conjunto sobre la producción de Valmore Rodríguez y de los temas que más le preocuparon en su vida de escritor y periodista.
La tematización que presentamos es una de las varias que quizá podrían intentarse. En tal sentido hemos organizado siete volúmenes que comprenden: 1. Ballonetas sobre Venezuela y Temas Políticos 2. Temas políticos 3. Temas Políticos 4. Política Internacional 5. Temas Económicos 6. Comunicación Social, Educación, Servicios Públicos y Temas Misceláneos 7. Literatura
En algunos de los volúmenes se han separado los subtemas a que haya lugar y ordenado alfabéticamente y numerados correlativamente. Sin embargo, los artículos que integran cada uno de los subtemas aparecen en orden cronológico, pues de esta manera, pensamos, se puede observar el tratamiento y evolución dado a un tema y los diversos momentos en que el autor se ocupó de ellos. Cada uno de los artículos lleva además del título un número que servirá para su recuperación en los respectivos índices, de manera de facilitar la consulta. Igualmente los artículos llevan su respectiva referencia hemerográfica y la mención a los que permanecían inéditos hasta el presente.
El libro ya publicado Bayonetas sobre Venezuela, se ha conservado como una unidad de acuerdo a como lo organizó su autor, pero a casa uno de los trabajos se le ha asignado un número para identificarlos en los índices. Además se han incorporado en este Tomo una serie de artículos que hemos identificado como Temas Políticos 1. Los prólogos que acompañan los libros se mantendrán por el interés que representan. En cada uno de los volúmenes se señalará el número de trabajos que contiene alguna peculiaridad digna de mención y su respectivo índice. En el séptimo volumen se incluirá el índice general de los escritos de época, un índice de fuentes consultadas y otro cronológico, cada uno de los cuales llevará el número de recuperación que se le haya asignado a cada uno de los artículos.
La búsqueda de estos materiales nos llevó a la investigación de numerosas colecciones de publicaciones periódicas de Maracaibo y Caracas, ciudades donde estuvo residenciado el autor por más tiempo. Como es de imaginar, algunos de sus escritos quedarán sin ser incluidos, pero ello no será por nuestro desinterés sino por el estado de alguna de las colecciones de periódicos consultadas que están incompletas, o que no pudimos conseguir como en el caso lamentable de Excelsior de 1925; El Nivel de 1928; El País de los meses que van de junio a diciembre de 1936, Democracia de 1938, todos ellos publicados en Maracaibo y en los cuales escribió Valmore Rodríguez.
Para finalizar deseo agradecer el interés prestado por los honorables Senadores que integraron la Comisión Especial designada para ocuparse de la publicación de esta obra; de igual manera quiero manifestar mi agradecimiento por la colaboración prestada por la familia de Valmore Rodríguez, en especial a sus hijos Valmore, Rosita y Alberto, al especialista en Información de la Hemeroteca Nacional Javier González y, por último, al Archivo de redacción de Panorama.
(1781 Caracas Venezuela - 1865 Santiago de Chile) Escritor, poeta, filólogo, filósofo, jurista, educador; Bello es el humanista más completo y una de las mentes investigadoras más agudas del siglo XIX en todo el ámbito de la cultura hispánica. Su nombre es autoridad en las ciencias del espíritu, en todas las ramas en que se interesó. Estudió en el seminario de Santa Rosa y se graduó de Bachiller en Filosofía y Ciencias en 1800. Desempeño cargos administrativos en el gobierno colonial. Su formación fue la de un autodidacta. En 1808, Bello es redactor de la "Gaceta de Caracas". Fue maestro de Bolívar adolescente. En 1810, viaja con Bolívar y López Méndez a Londres a solicitar ayuda para los patriotas. Bello se queda en Inglaterra enseñando castellano y latín y trabajando en sus investigaciones. En 1829 viaja a Chile y desempeña allí cargos político - administrativos y funda la universidad de la que es rector hasta su muerte. Entre sus poesías se destacan: "A la vacuna", "Oda a la nave", "Silvas americanas". Dejó 2 dramas: "Venezuela consolada" y "La España restaurada ". Su obra como filólogo y gramático es fundamental e insuperable.
Así tenemos su "Ortografía castellana", "Ortografía americana" y "Gramatica castellana", escrita en 1847. Como legislador, resalta su tratado de "Derecho Internacional" (1832), el "Código Civil de Chile" (1855), modelo de muchos códigos americanos. Fruto de sus preocupaciones metafísicas en su "Filosofía del entendimiento", y su "Resumen de la Historia de Venezuela". Tradujo autores franceses como Delille, Voltaire, Hugo y Dumas; ingleses como Locke y Byron, italianos como Boyardo y latinos como Virgilio y Horacio.
El rol del intelectual revolucionario lo estamos viendo. Los pensadores que impulsaron la revolución francesa, los llamados enciclopedistas, eran filósofos revolucionarios que vieron que el sentido de su época era que una nueva clase social –o al menos una clase social distinta a la que tenía el poder político (porque el poder económico ya estaba en manos de la burguesía)-, capitalista, debía tomar el poder político que todavía estaba en manos de la nobleza. Entonces estos intelectuales escriben un texto que es “La Enciclopedia” donde las brillantes plumas de los iluministas se unen para explicar lo que está pasando. En tanto lo explican, lo aclaran, inciden en los revolucionarios porque los revolucionarios, siempre que la realidad es puesta en ideas, no sólo luchan sino que saben por qué luchan.
*Filosofía aquí y ahora I. José Pablo Feinmann. Encuentro 4: La Filosofía corta la cabeza de Luis XVI...
.... ...El poder es aquello que permite a un grupo o fracción o incluso a una nación entera (si se trata de una guerra) imponer su verdad como verdad para todos. Y hasta, si es necesario, matar desde esa verdad a los que la niegan...
José Pablo Feinmann; Peronismo filosofía política de una obstinación argentina.
La inteligencia es, por mucho, el rasgo humano más importante. Esto es cierto tanto a nivel individual como a nivel de naciones. El desempeño cognitivo promedio de sus habitantes es el determinante más importante del desarrollo social, cultural y económico de las naciones. El artículo considera la capacidad cognitiva de las naciones desde la perspectiva de la investigación psicométrica de la inteligencia, los estudios internacionales de evaluación de estudiantes y la psicología del desarrollo de Piaget. Con base en datos actualizados, se estima el CI nacional de 205 países. Luego se muestra que los CI nacionales están estrechamente relacionados con una amplia gama de variables de diferentes dominios de la vida. En general, se demuestra que los hallazgos centrales de la investigación psicométrica de la inteligencia se mantienen inalterados. Una característica especial es la consideración de las relaciones no lineales. Usando un modelo de umbral específico derivado de la psicología del desarrollo de Piaget, se muestra que la importancia de los CI nacionales es mayor de lo que se creía previamente.
Integración de la investigación sobre inteligencia psicométrica, los estudios de evaluación de estudiantes internacionales y la psicología del desarrollo de Piaget
Actualización de los coeficientes intelectuales nacionales de 205 naciones.
Los coeficientes intelectuales nacionales están estrechamente relacionados con una amplia gama de áreas de la vida y son un excelente predictor del bienestar de las naciones.
Característica especial: Enfoque en las relaciones no lineales
Introducción
Hace miles de años, la gente notó que los grupos étnicos difieren entre sí en sus capacidades cognitivas, incluso si un concepto científico aún estaba muy lejos. Por ejemplo, Aristóteles escribió en su Política : «Los pueblos de las regiones frías y los de Europa son de carácter valiente, pero se quedan atrás en inteligencia y arte... Los pueblos de Asia, en cambio, son inteligentes y tienen talento artístico, pero son impotentes, y por lo tanto viven como subordinados y sirvientes». …El pueblo griego, viviendo por así decirlo en el medio entre los dos climas, tendría las ventajas de ambos lados, siendo enérgico e inteligente al mismo tiempo” (Vonderach, 2014, p. 13; traducción RH 1 ). Aquí ya tenemos una forma temprana de una teoría del clima, y hasta hoy algunos consideran las enormes diferencias entre las zonas climáticas como una causa principal de las enormes diferencias en inteligencia entre pueblos y naciones (en particular también Richard Lynn, quien es de suma importancia en el tema de la inteligencia de las naciones; ver por ejemplo Lynn, 2015). Queremos agregar solo una cita más. 2 Proviene de la “ Biblioteca de Historia ” del antiguo historiador griego Diodoro Sículo que vivió en el siglo I a. C. “Los egipcios son inteligentes, pero de una manera diferente a otros pueblos. Son expertos en las ciencias exactas y la geometría, pero no son tan capaces en el razonamiento abstracto como los griegos”. Esta afirmación es bastante extraordinaria. Parece que Diodoro distingue entre pensamiento concreto-operacional y formal-operativo en el sentido de Jean Piaget. Tan solo unos siglos antes, en la época de Sócrates y Platón, tal afirmación no habría sido posible, pues el pensamiento formal-operativo aún no existía. Sus inicios se remontan a Aristóteles y, tras un breve auge entre los helenistas, desapareció de nuevo hasta que emprendió su camino triunfal en el proceso de modernización del mundo occidental (Cohen, 2010; Oesterdiekhoff, 2013; Piaget y García, 1989; Russo, 2004).
Investigación de inteligencia psicométrica
Desde los inicios de la psicología científica hace más de 150 años, la inteligencia fue un tema central (Galton, 1869, 1883). Con la llegada de las pruebas psicométricas de inteligencia hace más de 100 años, se dispuso de información científicamente sólida de diferentes partes del mundo, pero la investigación sistemática exhaustiva sobre la capacidad cognitiva de las personas —o, más precisamente, de las naciones— no comenzó hasta la década de 1970. Desde entonces, se ha producido una revolución en la investigación psicométrica de la inteligencia, inextricablemente ligada a Richard Lynn, quien, primero por su cuenta y luego en colaboración con investigadores de todo el mundo, creó una base de datos empírica inigualable.
En cuanto al origen de esta fenomenal historia de éxito, dejemos que el propio investigador opine. «Comencé a recopilar los coeficientes intelectuales de las naciones en la década de 1970, impulsado por el rápido desarrollo económico de Japón y Singapur, y otros países de libre mercado del este de Asia en los años posteriores a la Segunda Guerra Mundial... Me preguntaba si podría haber diferencias de inteligencia entre las naciones que contribuyeran a estas diferencias en el desarrollo económico... Durante la década de 1980, recopilé datos sobre los coeficientes intelectuales de varios países y publiqué una compilación en Lynn (1991). Esta estableció el coeficiente intelectual británico en 100 (desviación típica de 15), y documenté estudios que mostraban que las naciones europeas también tenían un coeficiente intelectual promedio de 100, las naciones del noreste asiático un coeficiente intelectual promedio de 106, las naciones del sur de Asia y el norte de África un coeficiente intelectual promedio de 84, y las naciones del África subsahariana un coeficiente intelectual promedio de 70» (Lynn, 2018, p. 256).
En 2002, en colaboración con Tatu Vanhanen, publicó la obra seminal " CI y la riqueza de las naciones ", en la que los autores presentaron datos empíricos sobre los niveles de inteligencia de 81 países y estimaron puntuaciones para naciones adicionales, de modo que las 185 naciones con poblaciones superiores a 50.000 estuvieran representadas. Con este conjunto de datos, confirmaron los hallazgos previos de Lynn, en particular que los asiáticos orientales puntúan más alto en inteligencia que los europeos y que el nivel en el África subsahariana es de 70. Además, demostraron que la riqueza de las naciones, medida por el ingreso per cápita, está estrechamente relacionada con la inteligencia (en la submuestra de 81 países con puntuaciones de medición psicométrica, la correlación es de 0,73; en la muestra general, es de 0,62). También demostraron que las puntuaciones nacionales de CI se correlacionan excepcionalmente alta con los hallazgos de estudios internacionales de evaluación de estudiantes, matemáticas 88, ciencias 87.
En 2006, se publicó el trabajo colaborativo « CI y desigualdad global », y en 2012, « Inteligencia. Un constructo unificador para las ciencias sociales ». Estos trabajos ampliaron sustancialmente la base de datos empírica y proporcionaron un respaldo impresionante a los hallazgos anteriores. Además, los autores demostraron que la inteligencia está altamente correlacionada con numerosas variables destacadas en una amplia gama de dominios, como el logro educativo, el desempeño económico, la desigualdad social, la pobreza, las instituciones políticas, la salud, la fertilidad, el saneamiento, la corrupción, el crimen, las actitudes liberales frente a las conservadoras, la religiosidad y la felicidad. Pero no solo eso: al incluir adicionalmente otras variables que parecían ser relevantes en el dominio respectivo, Lynn y Vanhanen pudieron demostrar que la inteligencia tiene un poder explicativo mucho mayor que las variables competidoras; a menudo, la inteligencia por sí sola tiene un mayor poder explicativo que las otras variables combinadas.
En 2019, Lynn, en colaboración con David Becker, publicó « La inteligencia de las naciones ». La base de datos se amplió considerablemente y las estimaciones se refinaron. 3 Para complementar el libro, se creó la base de datos NIQ, mantenida principalmente por David Becker, y está disponible gratuitamente en internet en https://viewoniq.org/ (Becker, 2019). Con base en la base de datos ampliada, los hallazgos previos pudieron confirmarse en todos los aspectos y complementarse con otros nuevos.
Especialmente al principio, los libros de Lynn y Vanhanen fueron duramente atacados desde diversos frentes. Las acusaciones iban desde "¡Medir la inteligencia nacional no tiene sentido!" hasta el inevitable grito de "¡Racismo! ¡Racismo!". Por ejemplo, "Susan Barnett y Wendy Williams describieron nuestros coeficientes intelectuales nacionales como 'prácticamente insignificantes', y Earl Hunt y Robert Sternberg los describieron como 'insignificantes'". Sin embargo, Earl Hunt posteriormente cambió de opinión sobre la validez de nuestros CI nacionales porque en su libro Human Intelligence (2011, p. 440) escribió: «Las conclusiones de Lynn y Vanhanen sobre las correlaciones entre las estimaciones de CI y las medidas de bienestar social son probablemente correctas» (Lynn, 2020, p. 331-332). Y en 2018, Robert Sternberg publicó el capítulo de Richard Lynn The Intelligence of Nations en su libro The Nature of Human Intelligence . Richard Lynn comenta sobre esto: «Por lo tanto, en el transcurso de doce años, mis CI nacionales habían hecho la transición de «técnicamente inadecuados… y sin sentido» (Hunt y Sternberg, 2006) a la aceptación generalizada» (Lynn y Becker, 2019, p. 10).
Sin embargo, el grito de "¡Racismo! ¡Racismo!" continúa hasta el día de hoy. Abordaremos las acusaciones ideológicas en el debate.
Algunos investigadores reconocieron desde el principio la fecundidad del enfoque de Lynn; con el paso de los años, fueron cada vez más, y en una impresionante colaboración, surgió una red de investigadores de todo el mundo que generó una gran cantidad de hallazgos científicos. Nos abstenemos de mencionar los nombres de docenas de coinvestigadores y, en su lugar, nos remitimos a las "Memorias de un psicólogo disidente " de Lynn, donde ofrece una perspectiva esclarecedora sobre su extraordinario trabajo y reconoce el mérito de numerosos investigadores que han realizado contribuciones invaluables (Lynn, 2020).
En general, la línea de investigación establecida por Lynn ha demostrado de una manera sin precedentes que la inteligencia es con diferencia la variable más importante en los seres humanos.
En general, no hay una sola variable a la vista que sea independiente de la inteligencia y que tenga tanto poder explicativo en tantos dominios diferentes como la inteligencia.
Estudios de evaluación de estudiantes
Junto con el enfoque psicométrico, surgió otra poderosa rama de investigación que también aportó abundante información sobre la capacidad cognitiva de las naciones. Nos referimos, por supuesto, a los estudios internacionales de evaluación de estudiantes como PISA, TIMSS & Co. 4. En ellos, se evalúa a estudiantes de un grupo de edad claramente definido en intervalos determinados; por ejemplo, en el caso de PISA, a los jóvenes de 15 años, y en el caso de TIMSS, a los estudiantes de 4.º y 8.º grado. Estos estudios tienen la ventaja de contar con muestras amplias; y, dado que se utilizan procedimientos de prueba estandarizados, se pueden rastrear las tendencias de rendimiento a lo largo del tiempo. Inicialmente, los estudios se realizaban casi exclusivamente en países industrializados avanzados. Con el paso de los años, participaron cada vez más países, pero aún faltan muchos de los niveles de inteligencia más bajos. Sin embargo, existen algunos estudios regionales, por ejemplo, de África Occidental, el Sudeste Asiático, América Latina y el Sur de Asia. En cada caso, los organizadores han desarrollado sus propias pruebas adaptadas a los niveles de rendimiento mucho más bajos.
El punto clave es:
Las pruebas de rendimiento estudiantil no son lo mismo que las pruebas psicométricas de inteligencia, pero, por supuesto, el rendimiento estudiantil depende en gran medida de la inteligencia; y la inteligencia se desarrolla en el transcurso de esos años de escolaridad.
Richard Lynn y otros investigadores de la inteligencia lo han reconocido desde el principio. Por ejemplo, Weede y Kämpf (2002), Weede (2004), Weiss (2002, 2006, 2009, 2012, 2022), Rindermann (2006, 2007), Lynn y Mikk (2007). Lynn, Meisenberg, Mikk y Williams (2007). Meisenberg y Lynn señalan: «El CI y el rendimiento escolar están estrechamente relacionados. A nivel individual, dentro de cada país, las correlaciones entre las pruebas de CI y las pruebas de rendimiento escolar suelen oscilar entre 0,5 y 0,7 (Jencks, 1972; Jensen, 1998; Mackintosh, 1998), pero pueden alcanzar 0,8 (Deary et al., 2006). A nivel nacional, las correlaciones entre los resultados de las pruebas de CI y las evaluaciones académicas rondan el 0,9 (Lynn y Mikk, 2007; Lynn et al., 2007; Lynn y Meisenberg, 2010). Por lo tanto, ambos tipos de pruebas parecen medir constructos idénticos o estrechamente relacionados» (Meisenberg y Lynn, 2011, pág. 424). Este hallazgo, de suma importancia, se ha confirmado una y otra vez. Por ejemplo, Heiner Rindermann ofrece un análisis profundo. Muestra: los estudios de evaluación de estudiantes presentan una alta correlación entre escalas, grados, tiempo, estudios y enfoques. Y, este es el punto crucial, «también presentan una alta correlación con el CI psicométrico» (Rindermann, 2018, p. 94). En un análisis factorial conjunto de datos de PISA, TIMSS, PIRLS, estudios anteriores de evaluación de estudiantes y los CI nacionales según Lynn y Vanhanen (2012), surgió «un factor G muy fuerte, el primer factor no rotado de un análisis factorial; las cargas promedio son λ = 0,95» (p. 94). La carga de los CI nacionales de Lynn y Vanhanen es de 0,94.
Gracias a la excelente correspondencia, los investigadores de inteligencia han incorporado con entusiasmo el valioso tesoro de la disciplina afín a sus propios datos. En marcado contraste, los investigadores educativos, hasta la fecha, se niegan a tomar nota de la investigación psicométrica sobre inteligencia. La ignorancia llega a tal punto que la palabra «inteligencia» no aparece en absoluto en los informes oficiales ni en innumerables artículos de investigación, y el nombre de Richard Lynn es un tabú absoluto. «Convencionalmente, tal comportamiento podría describirse como plagio de ideas o, al menos, como mala conducta académica» (Rindermann, 2023, p. 715). Sin embargo, como veremos, la corrección política no modifica los hechos empíricos.
La psicología del desarrollo de Jean Piaget y la psicología del desarrollo transcultural piagetiana
Además de la investigación psicométrica sobre la inteligencia y los estudios de evaluación estudiantil, existe otro enfoque que ha arrojado hallazgos de extraordinaria importancia. Nos referimos a la psicología del desarrollo de Jean Piaget y a la psicología del desarrollo intercultural piagetiana. Si bien la investigación sobre la inteligencia y los estudios de evaluación estudiantil están en pleno auge, la contribución de Piaget ha quedado prácticamente olvidada.
La psicología del desarrollo piagetiana no proporciona estimaciones de la inteligencia nacional, pero su marco teórico es indispensable para comprenderla. El interés de Piaget se centra en el desarrollo de la inteligencia desde el nacimiento hasta la edad adulta temprana. La inteligencia no se da como un paquete predefinido al nacer, sino que se desarrolla en la interacción activa y continua con el entorno. El desarrollo se desarrolla según un patrón específico en el que se distinguen cuatro etapas cualitativamente diferentes. 5
La etapa sensoriomotora : La primera etapa se extiende desde el nacimiento hasta aproximadamente el año y medio o los 2 años de edad. Aquí, la inteligencia práctica se desarrolla sin pensamiento consciente ni racional.
Etapa preoperacional : La segunda etapa se extiende desde aproximadamente el año y medio a los dos años hasta los seis o siete años. En ella, se desarrollan la conciencia y el razonamiento simbólico. Sin embargo, el razonamiento es muy deficiente y «el niño en esta etapa vive en un mundo de cuentos de hadas, en un mundo de magia, monstruos, brujas, misterios, mitos e imposibilidades físicas» (Oesterdiekhoff, 2021).
Etapa de operaciones concretas : La tercera etapa se extiende desde los 6 o 7 años aproximadamente hasta los 11 o 12. En esta etapa se desarrolla la capacidad para las operaciones lógicas, pero —y este es el punto crucial— estas permanecen limitadas a la percepción y al propio mundo concreto de experiencias. Los patrones de pensamiento mágico-animistas irracionales se debilitan, pero aún permanecen presentes en cierta medida.
Etapa formal-operativa : Aproximadamente entre los 11 y los 12 años, se desarrolla el razonamiento reflexivo, abstracto y teórico. Solo en esta etapa encontramos el pensamiento hipotético, teórico-lógico, el razonamiento formal, el pensamiento contrafáctico, la metarreflexión, la superación de la perspectiva egocéntrica y la disociación entre pensamiento y percepción.
El concepto central que marca la diferencia entre la segunda y la tercera, y entre la tercera y la cuarta etapa, se denomina «Operaciones» de Piaget. Las operaciones son acciones reversibles. Su mejor descripción se encuentra en el famoso experimento de Piaget sobre la conservación del volumen.
Sobre la mesa hay dos vasos planos y anchos de forma idéntica, A y B, ambos llenos de agua hasta la misma altura. Junto a ellos hay un vaso vacío, alto y estrecho, C. Se le pide al sujeto que vierta el agua del vaso B en el vaso C. Los niños pequeños piensan que el vaso C contiene más agua que el vaso A. Cuando vierten el agua de C a B, creen que ha disminuido. Las personas en la etapa preformal son incapaces de considerar la altura y el área de la superficie simultáneamente y se centran en la característica más destacada, en este caso la altura. No comprenden que la reversibilidad de la acción es equivalente a la conservación del volumen. No es hasta la tercera etapa que se desarrolla la comprensión de las operaciones y el pensamiento lógico.
La diferencia entre la tercera y la cuarta etapa reside en el alcance de las operaciones. En la etapa concreta-operacional, las operaciones y el pensamiento lógico se vinculan al propio mundo concreto de la experiencia. Solo en el nivel formal-operacional, las operaciones y el pensamiento lógico también funcionan bien con conceptos abstractos y formales, así como con supuestos hipotéticos. Para ello, un ejemplo de los estudios realizados por Alexandr Luria en la década de 1930 entre la población rural mayoritariamente analfabeta de Uzbekistán: 6
P: Todos los osos son blancos donde siempre hay nieve; en Nowaya Zemlya siempre hay nieve; ¿de qué color son los osos allí? R: Solo he visto osos negros y no hablo de lo que no he visto. P: ¿Pero qué implican mis palabras? R: Si una persona no ha estado allí, no puede decir nada basándose en palabras. Si un hombre de 60 u 80 años hubiera visto un oso blanco allí y me lo hubiera contado, podría creerle.
Las personas en una etapa preformal no son capaces de extraer conclusiones lógicas simplemente de la estructura formal de un silogismo, no están dispuestas a ponerse en una situación hipotética y se niegan a extraer conclusiones de suposiciones postuladas en las que no creen. Esto no significa en absoluto que las personas preformales no puedan extraer conclusiones lógicas ni pensar hipotéticamente. Las conclusiones lógicas en situaciones de la vida real son comunes, y cuando se trata de Dios, dioses, fantasmas, espíritus, brujas y milagros, aceptan las fantasías más absurdas al pie de la letra.
Para resumir brevemente:
Las personas en una etapa preoperacional no pueden afrontar operaciones en absoluto.
Las personas en la etapa operacional concreta se enfrentan a operaciones sólo dentro de su propio mundo concreto de experiencia (operaciones de primer orden).
Las personas en la etapa operativa formal se ocupan de operaciones que van más allá de ésta (operaciones de operaciones; operaciones de segundo orden).
La psicología del desarrollo piagetiana transcultural ha demostrado que las etapas se pueden observar en todo el mundo; en ningún lugar se ha identificado una forma de pensamiento que no pueda ubicarse dentro de este marco conceptual.
El desarrollo cognitivo avanza de lo simple a lo complejo, con una creciente diferenciación y jerarquización. Este desarrollo es direccional e irreversible, salvo por lesiones cerebrales, trastornos mentales, deterioro relacionado con la edad o bajo la influencia de drogas.
Aunque las etapas son cualitativamente distintas entre sí, no son categorías estrictamente disjuntas, y la noción de una escalera sería sumamente engañosa. Dentro de las etapas, existe un desarrollo continuo mediante el cual las estructuras cognitivas se reorganizan paso a paso hasta que, en un punto crítico, el razonamiento adquiere nuevas cualidades. Existe, por ejemplo, una enorme diferencia entre el niño que acaba de superar la etapa preoperacional y el que está próximo a adquirir el pensamiento formal-operativo. Dentro de las etapas, se pueden distinguir subetapas.
Las especificaciones de edad se refieren a las sociedades industriales modernas. Se califican con «aproximadamente» porque el desarrollo se produce a un ritmo diferente en los individuos de una población y entre poblaciones.
Los individuos y las sociedades no residen en una sola etapa. Por ejemplo, el pensamiento formal suele restringirse a ciertas áreas de la vida que desempeñan un papel especial, mientras que, en otros casos, el razonamiento es de operaciones concretas o incluso preoperacional.
Todos los individuos sanos y todas las sociedades humanas alcanzan la segunda etapa, la preoperacional. Además, existen enormes diferencias entre los individuos de una misma población y también entre poblaciones.
El punto más importante es que la división fundamental no se da entre la segunda y la tercera etapa, sino entre la tercera y la cuarta. El pensamiento concreto-operacional supera muchas de las deficiencias flagrantes del pensamiento preoperacional, pero persisten vestigios del pensamiento mágico-animista y la perspectiva egocéntrica. Solo con el pensamiento formal-operacional se superan estas deficiencias y se abren posibilidades completamente nuevas. Solo quienes fueron capaces de pensar formal-operativamente pudieron crear el mundo moderno, caracterizado por las ciencias, la Ilustración, la industrialización, la racionalización, la secularización, la humanización y la democratización.
The fundamental cleavage may also be expressed in this way: People at preformal stages are at the cognitive developmental level of children. People at the formal-operative stage are at the developmental level of adolescents or young adults in modern societies, depending on the extent of formal thinking. Expressed in age and IQ scores, and compared to the level of development in modern societies, it can be roughly said:7 Adults with an IQ below 60 are at the cognitive level of up to 7-year-olds (preoperational). Adults with an IQ of 60 to 80 reside at the level of 7- to 12-year-olds (concrete-operational). IQ scores above 80 correspond to the various sub-levels of formal-operative thinking that unfolds around age 11.
These statements – this is of outstanding importance for our topic – apply not only to individuals, but to nations as well.
The Flynn Effect
As early as the first half of the 20th century, researchers noticed that performance on psychometric intelligence tests was improving over time. IQ tests are normed so that the population has a mean of 100. To ensure this continued to be the case, increasingly difficult tasks had to be inserted when tests were re-normed. The phenomenon was discussed in narrow circles but did not receive widespread attention. This did only change when James Flynn published two articles in the Psychological Bulletin in 1984 and 1987 entitled „The mean IQ of Americans: Massive gains 1932 to 1978“ and „Massive IQ gains in 14 nations: What IQ tests really measure.“ In the first, he showed that intelligence in the U.S. has increased massively over decades, while at the same time performance on the widely used college aptitude test SAT has stagnated or even declined. In the second article, he showed that a comparable increase in intelligence had occurred in other industrialized nations as well. Suddenly, the research community became aware of the explosive nature of this finding and a veritable research boom erupted and the phenomenon was given the name Flynn effect8 as suggested by Herrnstein and Murray (1994).
What is absolutely extraordinary about the Flynn effect is its sheer magnitude. Now that a mountain of empirical data and some meta-analyses are available,9 there is consensus that phenotypic intelligence has increased by about 0.3 points per decade in various countries during the 20th century. That, in turn, means that IQ has risen by about 30 points in the 20th century! This finding, which at first glance seems „completely impossible“, has caused considerable confusion among researchers for decades. Towards the end of this article, we will show that until today, some still do not understand the Flynn effect.
The Flynn effect is not limited to a few Western countries. It is a global phenomenon. All over the world, people are much more intelligent today than they were in 1900, although the gains vary in magnitude.
The Flynn effect is not a „never ending story“. For some time, there has been evidence that cognitive development has stagnated or even somewhat declined in several Western countries.10 Something similar is also reported for some countries in the Islamic world, for example Bakhiet et al. (2018), Bal-Sezerel, Ateşgöz, and Kirişçi (2023).
A key to understanding the Flynn effect was already provided by James Flynn in his 1984 article. As mentioned, he not only showed that IQ in the U.S. has massively increased over decades, but he also showed that at the same time performance in the college aptitude test SAT has remained the same or even decreased. Because the SAT, of course, also measures aspects of intelligence, this may seem absurd. But it is not at all. Intelligence is an extraordinarily broad construct that encompasses many different components. These all correlate positively with each other – which is the very basis for measuring general intelligence. The key point is: the components can develop differently over time without erasing the positive correlation with the others.
Over decades, Flynn sought to pinpoint the different gains in the various sub-areas of intelligence and to understand the basic pattern behind these. The largest gains are found in Raven’s Progressive Matrices, „there is a huge literature showing that Raven’s gains have proceeded at no less than 0.50 IQ points per year in every developed nation for which we have data“ (Flynn, 2009, p. 8).11 In the Wechsler intelligence tests,12 very large gains are found in the Similarities and Coding subtests for both adults and children; also in Vocabulary for adults and Block Design for children. Only small increases are found for Arithmetic and, for children, for Vocabulary and Information. People in advanced countries are no better at reading, writing, and arithmetic today than they were half a century ago, but during the 20th century thinking in other areas has attained a new quality. Raven’s matrices are completely abstract and „the entire test demands detaching logic from a concrete referent“ (p. 30). To illustrate the crucial point about the Similarities subtest, Flynn cites another example from Alexandr Luria’s study among the rural population of Uzbekistan in the 1930s (p. 29).
Q: What do a fish and a crow have in common? A: A fish – it lives in water. A crow flies. If the fish just lies on top of the water, the crow could peck at it. A crow can eat a fish but a fish can’t eat a crow. Q: Could you use one word for both of them? A: If you call them „animals” that wouldn’t be right. A fish isn’t an animal and a crow isn’t either. A crow can eat a fish but a fish can’t eat a bird. A person can eat a fish but not a crow.
The thinking is entirely directed to concrete aspects of practical usefulness; an abstract superordinate categorization is rejected as useless. „The Similarities subtest assumes exactly the opposite, that is, it damns the concrete in favor of the abstract“ (p. 27). This statement makes a key point: in today’s intelligence tests, abstract, theoretical, hypothetical thinking is rewarded and concrete thinking based on practical utility is devalued as „false“.
Today’s intelligence tests measure something different from earlier tests, or rather, they evaluate performance according to different standards.
In some sub-areas, today’s intelligence tests require capabilities that are not necessary in less developed societies and that were not developed at all for most of human history.
In Flynn’s interpretation, the fundamental change is that over the course of the 20th century, broader and broader segments of the population replaced the utilitarian mindset with a scientific one and took hypothetical problems seriously.
Of particular interest is Flynn’s explicit reference to Jean Piaget’s developmental stages. „Virtually all people in 1900 lived in a pre-scientific age. This is not to say that the distinction between concrete vs. formal is identical to the distinction between pre-scientific vs. post-scientific13... However, the two are undoubtedly causally linked in terms of historical context. People lacking in a scientific perspective are much more likely to have their intelligence grounded on the concrete level. No one can go back to 1900 and give Piagetian tests. I merely assert the following as a plausible hypothesis: most people were on the concrete level in 1900; a majority of people today move to the formal level in their early teens and, by adulthood, they are overwhelmingly on the formal level“ (Flynn, 2009, pp. 32-33). The last half-sentence applies to industrialized nations, but, as we will see in the next section, in large parts of the world the picture looks different. The important point is the realization that most people in 1900 were at the concrete-operational level. Flynn understood the implication perfectly: Until not all that long ago, people, with few exceptions, did not advance beyond the reasoning patterns of modern children. But he rightly points out that people in earlier times were of course not mentally retarded. Our ancestors coped with their world of life just as well as we do with ours. They were only able to think in the patterns of children, but they accomplished great achievements thousands of years ago that we still admire today.
The first is the statement „The ultimate cause of IQ gains is the Industrial Revolution. The intermediate causes are probably its social consequences, such as more formal schooling, more cognitively demanding jobs, cognitively challenging leisure, a better ratio of adults to children, richer interaction between parent and child … Donning scientific spectacles with the attendant emphasis on classification and logical analysis is only the proximate cause” (pp. 15-16). The first sentence is reminiscent of Piaget’s spillover task on volume conservation. Here, as there, it is a mistake to focus only on the most eye-catching dimension. In the spillover task, the outcome is affected by only two dimensions, height and base area. In the evolution of intelligence, on the other hand, it is the hypercomplex interactions in a network of uncountable variables. The Industrial Revolution was undoubtedly of paramount importance, but it must not be considered in isolation. In particular, it is not only a cause, but also an effect at the same time; it could only emerge because intelligence in the Western world had risen beforehand. No, there is no single variable that is the ultimate cause of the Flynn effect. The ascent to the formal-operative stage occurred in the process of modernization, not only as a consequence but at the same time as a cause. The process has no specific starting point and it emerged from human evolution as a whole.
The second point is the ever-controversial issue of genes and environment, which we will not otherwise discuss further. It is obvious that the Flynn effect of the 20th century is not a genetic phenomenon. Genetic changes do not occur globally, and genetic changes even point in the opposite direction during this period. Of course, it does not follow from looking at the 20th century that the evolution of intelligence had no genetic causes. The opposite is true. There is ample evidence that for centuries the upper classes in Western Europe had more viable offspring than the lower classes, and that many from the lower intelligence range were almost completely excluded from reproduction.14 Because social status is positively correlated with intelligence and intelligence is to a considerable extent heritable, it follows that there was a genetic sifting for higher intelligence in Western Europe for centuries.15 The eugenic16 trend was probably a crucial factor in northwestern Europe’s rise to the formal-operative stage. Since the mid-19th century, with the rapid improvement of general living conditions, this relationship has been reversed. However, the weak dysgenic effect was far outweighed by the extraordinary improvements in environmental conditions, resulting as a net in a positive Flynn effect.17 If environmental conditions in modern societies have indeed reached a temporal limit, then a decline in intelligence is inevitable given the prevailing reproductive pattern. We will consider the future prospects of intelligence at the end of this article.
The Global Learning Crisis
Student assessment studies have also produced a major finding, although not as revolutionary as the Flynn effect. „The World Bank’s 2018 „World Development Report” presents two messages, one good and one bad. The good one is that all countries in the world have made great efforts and massively increased school enrollment. With few exceptions, almost all children can now attend school everywhere in the world. The bad news is: … Today, almost all children can attend school, but hundreds of millions learn next to nothing. This statement is not an exaggeration, but a depressing fact that can no longer be swept under the rug and is referred to by UNESCO as the Global Learning Crisis (UNESCO, 2013) … international student assessment studies have shown over and over again that in many countries achievement levels are far below what would be considered the minimum in modern industrialized societies. The following quotes give an idea of how dramatic the situation is: „for hundreds of millions of children in the developing world, schooling is not producing „education“ in any real sense... hundreds of millions of children finish schooling lacking even the basic literacy and numeracy skills of the nineteenth century“ (Pritchett, 2013, p. xi and p. 14). The „nineteenth century“ time reference is not a misquotation. In many regions, educational attainment is below 19th century Western levels, not to mention the 20th century. „Worldwide, hundreds of millions of children reach young adulthood without even the most basic life skills“ (World Bank, 2018, p. 3). „In fact, a large share of children in low-income countries complete their primary education lacking even basic reading, writing, and arithmetic skills“ (Bold et al., 2017a, p. 2); „in South Asia and sub-Saharan Africa, a majority of students spend years of instruction without any noticeable progress on basic learning outcomes“ (Hanushek and Woessmann, 2015, p. 139)“ (Henss, 2023).
For us, two points are pertinent. First, student assessment studies confirm the extraordinarily low levels in sub-Saharan Africa. For uttering this empirical fact, intelligence researchers have been vilified as racists. Second, the studies show that the underachievement of many nations is not just quantitative in nature. The core problem is not merely that students can solve too few tasks; the core problem is that formal reasoning skills are completely lacking. As long as simple tasks can be solved purely mechanically, at least some of the students succeed, but as soon as minimal conceptual understanding is required, they fail across the board. In many countries, substantial parts of the population are incapable of formal-operative thinking, and this is not limited to sub-Saharan Africa alone.
Non-linear Relationships
The cognitive development of mankind has an interesting implication. Numerous aspects that characterize life in modern industrial societies were not possible until a basic degree of formal-operative intelligence was established. For nations that have not yet surpassed this threshold, some achievements may be out of reach. In some cases, it may not matter whether the level of intelligence is only just or far below the threshold. It is only when the threshold is passed that formal-operative intelligence has an impact. That is, the relationship between intelligence and some of its correlates is different above and below the threshold.
The relationship of intelligence to other variables is mostly quite simple, namely linear. However, there is no shortage of variables where the relationship is non-linear. For example, Lynn and Vanhanen (2012) or Lynn and Becker (2019) provide several scatterplots where the non-linearity is eye-catching. The authors called attention to this, but did not pursue the matter further. Many other authors have also hinted at non-linear relations, and some of them have explicitly considered alternative models (for example, Brown, Wai and Chabris (2020), Coyle, Rindermann, Hancock and Freeman, 2018; Grinin and Korotayev, 2015; Haque and Kneller, 2005; Lv, 2017). However, in the majority of cases, the non-linearity is not even noticed or the authors nonetheless restrict themselves to linear correlation. This then has the consequence that the strength of the relationship is underestimated, in some cases considerably.
In this paper, we will only consider a quite specific form of nonlinearity. This form is immediately obvious when looking at some scatterplots, but oddly, it is only rarely taken into account. Figure 1 illustrates this with corruption as an example. The national IQs that we derive below are plotted on the X-axis. The Y-axis shows Freedom from Corruption according to Transparency International’s Corruption Perception Index (2022) (note: a higher value indicates lower corruption). The dots each mark a nation. The solid line is the regression according to the Threshold Model of formal-operative Intelligence (Henss, 2021).
Figure 1. Intelligence and Freedom from Corruption.
The basic idea of the model is immediately apparent from the shape of the regression line. In the lower intelligence range, corruption is basically high. It does not matter whether the national IQ is below 70 or just above 80. Only above a certain point – in this case, above a national IQ of 83 – does intelligence have an effect. As the intelligence of the population increases, the containment of corruption becomes more successful, and this relationship is linear. We interpret this pattern in terms of Piaget’s stages of cognitive development: Curbing corruption is only possible if a certain minimum proportion of the population is capable of formal-operative thinking (or with the help of external intelligence provided from outside). The larger this proportion, the lower the level of corruption. Moral development goes hand in hand with cognitive development (Piaget, 1948, Kohlberg, 1984), and only at the level of formal-operative intelligence are societies able to curb the strong tendency toward self-interest and in-group favoritism for the benefit of the population at large.
The superiority of the threshold model over the linear model is obvious to the naked eye. In the specific example, the linear correlation is.63, while the nonlinear correlation is.68, thus increasing the proportion of variance explained from 39.6 percent to 46.9 percent.18 This means that the linear model considerably underestimates the association between intelligence and corruption.
The basic principle we illustrated for corruption applies to many other variables as well. Some examples can be found in Henss (2021) and we will present additional ones in this paper.
Aims of this Study
The scope of this article is immediately apparent from its three-part title.
The Intelligence of Nations: We consider cognitive ability at the level of nations. That is, we are not concerned with individuals, schools, or educational systems.
National IQs: We look at phenotypic intelligence as measured by psychometric intelligence tests and by the tests of student assessment studies. Genotypic intelligence is not the subject of our study; in particular, we do not address the question of which proportions are due to genetic factors and which are due to environmental factors.19
Correlates: Calculating national IQs is not an end in itself. The average intelligence of the population has an impact on countless areas of life, and we demonstrate this by looking at a variety of correlates from different spheres.
First, we will show a further time that there is a very high degree of concordance between the findings of psychometric intelligence research and international student assessment studies. Then, for each nation, we will derive an estimate of national IQs based on both approaches. Estimating national IQs and tabulating them is not an end in itself. The key point is that myriad characteristics that we value positively are positively correlated with intelligence. Nations with more intelligent populations have enormous advantages in a wide variety of areas of life. We will demonstrate this through a couple of examples. We are not aiming for a comprehensive systematic review; after all, there are innumerable variables that could be taken into account. We have just selected a few up-to-date datasets from different areas of interest, each of which takes a number of variables into account.20 This paper is concerned only with demonstrating substantial correlations of national IQs with a wide variety of variables. It is not concerned with questions of cause and effect; these are outside our scope. As a distinguishing feature, we will also look at non-linear relationships.
Methods
The empirical part of our work has two aspects, an internal and an external one. The internal aspect concerns the estimate of national IQs, the external one concerns their correlates across a variety of domains.
Up-to-date Estimate of National IQs
Student assessment studies investigate the performance of children and adolescents. The tests usually address the domains of Reading and/or Mathematics and/or Sciences. Intelligence researchers employ psychometric intelligence tests that cover a broad range of subdomains, and they assess children, adolescents, and adults of all ages. Because intelligence researchers also consider student assessment studies, there is considerable overlap between the two approaches. The overlap is not a shortcoming. On the contrary, if one wants to get a complete picture, one has to consider all available data sources.
Recently, Russell T. Warne has provided a downloadable database that includes the results of the two research traditions (Warne, 2022). This is one of the most up-to-date and most comprehensive compilation of the intelligence of nations.21
The intelligence research data are from the NIQ dataset by Becker (2019). Three estimates were considered: the national IQs according to Lynn and Vanhanen (2012), according to Heiner Rindermann, and according to David Becker. We refer to them hereafter as LV12, R, and NIQB.22 R and NIQB are both extensions of LV12.
The data from the student assessment studies come from the World Bank (Harmonized Learning Outcomes; Angrist et al., 2021) and Gust, Hanushek, and Woessmann (2022), who sought to overcome some shortcomings of Angrist et al.’s estimates. We refer to them as HLO and GHW. In addition to the large-scale PISA, TIMSS, and PIRLS studies, they also include small-scale studies from Africa, Asia, and Latin America.
The five sets are the basis of our analysis. We have made only three minor modifications. In the student assessment studies, the scores for Cuba are 101 (HLO) and 104 (GHW) and for Pakistan 64 (HLO) and 62 (GHW). This would make Cuba dwarf the entire Western world and Pakistan among the very least intelligent countries on earth. The data collection may well have been accurate, but there is no way it could have been representative samples. That is something like measuring the average height of young adult males and reporting an average of 1.96 meters for Cuba and an average of 1.56 meters for Pakistan. That may be correct for the Cuban national basketball team and the Pakistan national polo team, but it has nothing to do with the national average. The same is true for the score of 100 for Cambodia in the NIQB. Cambodia had participated in the special PISA for Development Programme and performed disastrously (OECD, 2018). The score 100 is based on a study by Bakhiet, Sles, Lynn, and Meisenberg (2018). They tested the cognitive abilities of a representative sample of students from the capital city of Phnom Penh using Raven’s Standard Progressive Matrices Plus. Cambodia has a population of 17 million. Only a quarter live in cities, of which 2.3 million live in the capital. Cognitive ability is certainly much higher in the metropolis than in the rural population, which is the vast majority. Raven’s Progressive Matrices are considered a very good measure of general intelligence. However, it is well known that it is just abstract formal reasoning, which is measured by this test, that shows the largest Flynn effect (Flynn, 2009, 2012). In other subdomains, the secular gains are much smaller. The score of 100 is not representative of the phenotypic intelligence of the Cambodian population. It is the reflection of modernization effects on the abstract formal reasoning of metropolitan students. The non-useful scores were, of course, excluded.
In total, the database comprises hundreds of studies with millions of subjects. The data for the highly developed nations are much more abundant and reliable than for the mid-level countries, and the data for the less developed countries are sparse.
We will show that the five datasets are in very high agreement. From these, we will derive our own estimate of national intelligence for 205 nations and summarize them in a table.
Correlates of National IQs
National IQs are of paramount importance because the average intelligence of the population is – often very closely – related to countless variables from quite different domains. We will demonstrate this using a sample of variables derived from well-established indexes.
Table 1 provides an overview of the indexes, the sources, and the number of nations and variables.
Index / Variable
Source
Nations
Var
Human Development Index
UNDP (2023)
191
39
Social Progress Index
Social Progress Imperative (2022)
133-169
76
Global Innovation Index
World Intellectual Property Organization (2022)
132
8
Global Talent Competitiveness Ind.
INSEAD (2022)
133
7
Democracy Index
Economist Intelligence Unit (2023)
166
6
Index of Economic Freedom
Kim (2023)
175-181
14
Global Health Security Index
Bell and Nuzo (2021)
189
7
World Happiness Report
Helliwell et al. (2023a, b)
108-114
9
Positive Peace Index
Institute for Economics & Peace (2022a, b)
162
32
Global Peace Index
Institute for Economics & Peace (2022a, b)
162
4
Total Fertility Rate 2022
Roser (2014)
189
1
Table 1. Correlates of Intelligence. Indices, Source, Number of Nations and Variables.
Human Development Index 2022 The Human Development Index is probably the best-known index. The core variable HDI is a composite of Life Expectancy at Birth, Years of Schooling, and Gross National Income per capita. In addition, the Human Development Index looks at numerous other variables, some of which refer to the Sustainable Development Goals (SDGs) of the United Nations’ 2030 Agenda for Sustainable Development (United Nations, 2022a, n.d.).
Social Progress Index 2022 The Social Progress Index „is the only measurement tool to focus exclusively comprehensively and systematically on the non-economic dimensions of social performance across the globe with transparent and actionable data“ (Social Progress Imperative, 2022, p. 1). From 60 indicators, the overall score and 3 domains with 4 sub-domains each are obtained. Basic Human Needs (Nutrition & Basic Medical Care, Water & Sanitation, Shelter, Personal Safety), Foundations of Wellbeing (Access to Basic Knowledge, Access to Information & Communication, Health & Wellness, Environmental Quality), Opportunity (Personal Rights, Personal Freedom & Choice, Inclusiveness, Access to Advanced Education).
Global Innovation Index 2022 This index looks at science, innovation, and technological progress. In addition to the Overall GII, it considers Institutions, Human Capital and Research, Infrastructure, Market Sophistication, Business Sophistication, Knowledge and Technology Outputs, and Creative Outputs.
Global Talent Competitiveness Index 2022 This index looks at the global race to recruit the brightest minds who are of highest importance for science, innovation and technology. In addition to the Overall GTCI, we consider the six pillars of Enable, Attract, Grow, Retain, Global Knowledge Skills, Vocational and Technical Skills. In the sample of 133 nations, only 13 belong to the low-income group. This is reasonable, as the vast majority of this group does not stand the slightest chance in the competition for the brightest brains due to the very low national intelligence.
Democracy Index 2023 The Democracy Index is based on five categories: Electoral Process and Pluralism, Functioning of Government, Political Participation, Political Culture, Civil Liberties.
Index of Economic Freedom 2023 The Index is divided into four areas, each with three sub-areas. These are: Rule of Law (Property Rights, Judicial Effectiveness, Government Integrity); Government Size (Tax Burden, Government Spending, Fiscal Health); Regulatory Efficiency (Business Freedom, Labor Freedom, Monetary Freedom); Market Openness (Trade Freedom, Investment Freedom, Financial Freedom).
Global Health Security Index 2021 The GHS Index assesses the ability to respond promptly and appropriately to health threats. The six main categories relate to the capability to Prevent, to Detect, and to Respond to biological threats and to Health Systems, Norms, and Risks that can strengthen or hinder this capability.
Global Peace Index 2022 In addition to the Overall GPI, the Global Peace Index takes into account Safety and Security, Ongoing Conflict, Militarization.
Positive Peace Index 2022 Alongside the Overall Score, the Positive Peace Index considers the six pillars Rights of Others, Equitable Distribution of Resources, Free Flow of Information, Good Relations with Neighbors, High Levels of Human Capital, Low Levels of Corruption. These pillars are based on three indicators each.
World Happiness Report 2023 The core variable of the World Happiness Report is the overall assessment of quality of life. The source is a question from the Gallup World Poll: „Please imagine a ladder, with steps numbered from 0 at the bottom to 10 at the top. The top of the ladder represents the best possible life for you and the bottom of the ladder represents the worst possible life for you. On which step of the ladder would you say you personally feel you stand at this time?“. This so-called Life Ladder or Cantril Ladder may be interpreted as Happiness, Life Satisfaction or Well-Being. The report also takes into account Gross Domestic Product per capita, Social Support, Healthy Life Expectancy at Birth, Freedom to make Life Choices, Generosity, Perceptions of Corruption, Positive Affect, Negative Affect.
Total Fertility Rate 2022 Finally, we look at a variable that, along with intelligence, is possibly the most crucial variable for the future of humanity, namely the Total Fertility Rate. This is the average number of children a woman can expect to have over her lifetime. It is generally assumed that in highly developed industrial nations about 2.1 births per female are required to keep the population level constant when net migration is zero. Due to higher mortality rates, a higher number may be required in low-developed countries.
In a preliminary analysis, we performed a regression of the variables on intelligence and calculated the standardized residual for each nation. In most cases, North Korea showed an exceptionally large deviation. For example, in the Positive Peace Index, for 25 out of 32 variables, the residual was greater than 3 standard deviations. In the Democracy Index, all residuals were greater than 4.9. The Index of Economic Freedom 2023 uses a scale of 0 to 100, with Sudan (32.8), Venezuela (25.8), and Cuba (24.3) at the very bottom. On the very last place is North Korea with only 2.9 points. All this makes it clear: North Korea belongs to a different universe and was therefore excluded from further consideration.
Non-linear Relationships
A distinctive feature of our work is the explicit consideration of a specific form of a non-linear relationship, which we proposed under the name Threshold Model of formal-operative Intelligence (Henss, 2021). The theoretical background is the profound qualitative difference between formal and preformal reasoning in the sense of Jean Piaget. The basic idea was outlined when we looked at Freedom from Corruption in Figure 1. Let us express it in a different way. There is a point that divides the intelligence spectrum into two areas. In one range, intelligence plays no role. Only beyond the threshold, intelligence comes into play, and in our particular model, we assume that the relationship is linear. We interpret the threshold as the point at which formal-operative intelligence takes effect. We leave open whether the cognitive elite plays a decisive role, as suggested, for example, by smart fraction theory (e.g. Kirkegaard and Carl, 2022; La Griffe du Lion, 2002; Rindermann, Sailer and Thompson, 2009; Wai and Rindermann, 2017). In the graphical display, the regression line is represented by a horizontal line and a rising or falling branch. Depending on the second variable, the plateau can be in the lower or in the upper intelligence range.
If, as in Figure 1, the plateau is below the threshold, the functional equation of the threshold model is defined as follows:
f(x) = c for x ≤ T and c + (x – T)×a for x > T
Here, f() stands for the threshold model function, x for the national IQ, T for the threshold intelligence, c for the constant in the sub-threshold range, and a for the slope in the supra-threshold range. The functional equation has no analytical solution. The parameters T, c and a can only be determined by numerical optimization.23
Results
Our analysis is based on five datasets from Warne’s database (2022). The national IQ estimates LV12, R, and NIQB come from psychometric intelligence research, HLO and GHW from student assessment studies. Table 2 shows the product-moment correlation between the five datasets.
LV12
R
HLO
GHW
NIQB
.87
.88
.84
.89
LV12
.98
.87
.92
R
.90
.93
HLO
.93
Table 2. Correlation between estimates of national IQs.
The correlations are all very high. David Becker’s NIQB shows the lowest commonality. Here the values range from.84 to.89. But even with the lowest agreement (NIQB and HLO), the common variance is 70.8 percent. Heiner Rindermann’s R shows the greatest commonality. At.98, it is almost congruent with Lynn and Vanhanen’s 2012 dataset.24 Of particular note is the high agreement with the student assessment values. The correlation with the HLO is.90. The correlation with the GHW is even.93, which is as high as the agreement between the two student assessment measures. Furthermore, the correlation between LV12 and GHW is only.01 smaller as well. Gust, Hanushek, and Woessmann specifically aimed to overcome some shortcomings of the HLO. This brings the GHW even closer to the estimates from psychometric intelligence research.
Due to the very high correlations, a highly reliable measure of national intelligence can be constructed. For each nation, the median across the five datasets was computed (which correlates with the arithmetic mean at.99).25 Hereafter, we will refer to our own estimates as nIQ. The estimates for each country will be presented in Table 5. Before doing that, we want to delve a bit deeper into our analysis.
Table 3 shows statistics for the source datasets as well as our nIQ. The mean and median were calculated without weighting nations by population size. Thus, these are not estimates of the world IQ, which is 86.7.
LV12
R
NIQB
HLO
GHW
nIQ
Nations
199
199
200
161
157
205
Minimum
60.1
60.2
60.0
58.8
55.0
62.0
Maximum
107.1
105.3
106.5
107.7
108.6
107.1
Mean
84.4
83.2
82.3
84.8
84.0
83.2
Median
84.6
82.6
83.0
84.6
83.4
83.0
Table 3. Statistics for the source datasets and our own estimates.
The differences are very small.26 It is only worth mentioning that the minimum is lower for the student assessment studies, even though they consider fewer nations.
Two Approaches, one Outcome
Within psychometric intelligence research and within student assessment studies, the median was calculated for each nation. The product-moment correlation between the two estimates is.93 (N = 168). The very high agreement is illustrated by Figure 2. The intelligence research estimates are plotted on the X-axis, and the student assessment estimates on the Y-axis. The dotted line marks the linear regression line.
Figure 2. Estimates of National IQs from Psychometric Intelligence Research and Student Assessment Studies.
It is evident at first glance that the agreement is much greater in the upper intelligence range than in the middle and lower ranges. Since much more abundant data are available for the more intelligent countries, this was to be expected. In 130 of 168 cases, the difference is smaller than 5 points; in 50 cases, it is even smaller than 1 point. Only in eight nations is the difference larger than 10 points, the maximum being 14.8 points.27 Overall, the estimates from intelligence research and student assessment studies are virtually identical: the mean is 83.9 and 84.0, respectively, and the median 84.0 and 83.3.
PISA 2018 and National IQs
Among international student assessment studies, PISA is the most important. Therefore, it is worth comparing it with our estimates of national IQs.28
PISA measures performance in three domains, Reading, Mathematics, and Sciences. Table 4 shows the product-moment correlations between the domains, the overall PISA 2018 score (= mean of the three domains), and our nIQ estimates.
Mathematics
Sciences
PISA 2018
nIQ
Reading
.95
.98
.99
.94
Mathematics
.97
.99
.95
Sciences
.99
.95
PISA 2018
.96
Table 4. Correlations between PISA domains, PISA total, and nIQ.
Table 4 tells an unequivocal story. First, the three domains generate nearly identical results (.95,.97,.98). Second, all three domains match perfectly with the PISA total score (.99). Third, all three domains and the PISA total score correlate exceptionally highly with our nIQ (.94,.95,.95,.96). In view of the extraordinarily high congruency, it should be reminded that student assessment data are included as a subset in our national IQs. Becker’s NIQ dataset includes a variable, QNW, based solely on psychometric intelligence tests. This correlates with HLO, GHW, and PISA 2018 at.82,.83, and.84, respectively. Overall, this means that at the nation level, PISA actually measures a single construct and that is intelligence.
In terms of absolute scores, the agreement is also overwhelming. For 36 nations, the difference between the PISA total score and our nIQ is less than 1 point. In 18 nations, it is between 1 and 2 points; in 9 nations between 2 and 3; in 5 nations between 3 and 4; in 6 nations between 4 and 5. Only in 4 cases is the difference greater than 5 points: Albania (5.65), China (BSJZ) (6.05), Qatar (6.13), and Macau (China) (6.42).
In the case of China, it should be noted that out of 31 provinces, only Beijing, Shanghai, Jiangsu and Zhejiang participated in the PISA study, hence the add-on (BSJZ). The four provinces are much more advanced than the rest of the country, and the IQ is much higher.29 If China as a whole were taken into account, the difference from our nIQ would be lower by a few points. Qatar also deserves separate mention. Large numbers of migrants have entered the country in recent times. At 56.8 percent, migrants are the overwhelming majority, and they are much more intelligent than the native population. In the 2018 focus domain, Reading, the difference is 92 to 80 IQ points (OECD, 2019a, b). The migrants raised the score in PISA 2018, but of course, in previous studies they could not be included yet. In the particular case of Qatar, PISA 2018 is probably closer to the present situation than our nIQ.
Brief Summary and Conclusion
As expected, the five original datasets strongly correlate with each other. Hence, it follows that the aggregate estimates from intelligence research, on the one hand, and student assessment studies, on the other hand, also match to a high degree. Thus, a highly reliable estimate of national IQs can be derived from the database. The commonalities are so strong that each of the three PISA domains is in excellent accord with our estimate.
From all this we conclude:
Psychometric intelligence tests and the international student assessment studies essentially measure the same latent variable, namely intelligence.
National IQs at a Glance
Our central goal is to estimate national IQs at the most comprehensive and up-to-date level. The result can be seen in Table 5. It shows the values for 205 nations. The left part is arranged in descending order of IQ, the right alphabetically.
Nation
IQ
IQ
Nation
Singapore
107
72
Afghanistan
China
106
82
Albania
Hong Kong
105
80
Algeria
Korea, South
105
95
Andorra
Taiwan
105
70
Angola
Japan
104
71
Antigua and Barbuda
Korea, North
104
87
Argentina
Finland
101
91
Armenia
Netherlands
101
99
Australia
Canada
101
99
Austria
Estonia
101
85
Azerbaijan
Liechtenstein
101
84
Bahamas
Switzerland
100
87
Bahrain
United Kingdom
100
74
Bangladesh
Macau
100
80
Barbados
Germany
100
96
Belarus
New Zealand
100
100
Belgium
Sweden
100
72
Belize
Belgium
100
71
Benin
Australia
99
90
Bermuda
Czechia
99
78
Bhutan
Austria
99
82
Bolivia
Slovenia
99
89
Bosnia, Herzegovina
Denmark
99
77
Botswana
Hungary
98
84
Brazil
Iceland
98
88
Brunei
France
98
93
Bulgaria
United States
98
70
Burkina Faso
Slovakia
98
72
Burundi
Ireland
98
73
Cabo Verde
Poland
97
87
Cambodia
Latvia
97
64
Cameroon
Norway
97
101
Canada
Croatia
97
82
Cayman Islands
Russia
97
64
Central African Rep.
Spain
97
66
Chad
Luxembourg
97
89
Chile
Italy
96
106
China
Lithuania
96
83
Colombia
Belarus
96
75
Comoros
Andorra
95
66
Congo, Dem. Rep.
Portugal
94
72
Congo, Rep.
Israel
94
88
Cook Islands
Malta
94
87
Costa Rica
Vietnam
94
70
Cote d’Ivoire
Ukraine
94
97
Croatia
Cyprus
93
84
Cuba
Bulgaria
93
93
Cyprus
Greece
93
99
Czechia
Serbia
91
99
Denmark
Mongolia
91
72
Djibouti
Greenland
91
66
Dominica
Armenia
91
80
Dominican Republic
Malaysia
91
83
Ecuador
Moldova
91
78
Egypt
Romania
90
78
El Salvador
Bermuda
90
69
Equatorial Guinea
Turkey
89
74
Eritrea
Thailand
89
101
Estonia
United Arab Emirates
89
69
Ethiopia
Suriname
89
84
Fiji
Chile
89
101
Finland
Uruguay
89
98
France
Bosnia, Herzegovina
89
69
Gabon
Cook Islands
88
62
Gambia
Brunei
88
83
Gaza Strip
Mauritius
88
100
Germany
Trinidad and Tobago
88
87
Georgia
Argentina
87
64
Ghana
Mexico
87
93
Greece
Samoa
87
91
Greenland
Costa Rica
87
74
Grenada
Cambodia
87
79
Guatemala
Kazakhstan
87
65
Guinea
Bahrain
87
68
Guinea-Bissau
Georgia
87
79
Guyana
Jordan
87
67
Haiti
Montenegro
86
80
Honduras
Iraq
86
105
Hong Kong
Netherlands Antilles
86
98
Hungary
Iran
86
98
Iceland
North Macedonia
85
77
India
Myanmar
85
83
Indonesia
New Caledonia
85
86
Iran
Azerbaijan
85
86
Iraq
Tonga
85
98
Ireland
Turks and Caicos Isl.
84
94
Israel
Cuba
84
96
Italy
Fiji
84
75
Jamaica
Brazil
84
104
Japan
Bahamas
84
87
Jordan
Marshall Islands
84
87
Kazakhstan
Micronesia
84
76
Kenya
Turkmenistan
84
83
Kiribati
Seychelles
83
104
Korea, North
Indonesia
83
105
Korea, South
Oman
83
79
Kosovo
Venezuela
83
80
Kuwait
Laos
83
76
Kyrgyzstan
Pakistan
83
83
Laos
Colombia
83
97
Latvia
St Helena, Asc., Tristan
83
83
Lebanon
Kiribati
83
70
Lesotho
Gaza Strip
83
65
Liberia
Lebanon
83
83
Libya
Libya
83
101
Liechtenstein
Ecuador
83
96
Lithuania
Vanuatu
82
97
Luxembourg
Uzbekistan
82
100
Macau
Tajikistan
82
77
Madagascar
Paraguay
82
65
Malawi
Albania
82
91
Malaysia
Cayman Islands
82
81
Maldives
Syria
82
67
Mali
Timor-Leste
82
94
Malta
Puerto Rico
82
81
Mariana Islands
Bolivia
82
84
Marshall Islands
Peru
82
69
Mauritania
Solomon Islands
81
88
Mauritius
Nicaragua
81
87
Mexico
Tunisia
81
84
Micronesia
Mariana Islands
81
91
Moldova
Qatar
81
91
Mongolia
Maldives
81
86
Montenegro
Kuwait
80
75
Morocco
Philippines
80
72
Mozambique
Honduras
80
85
Myanmar
Barbados
80
68
Namibia
Panama
80
73
Nepal
Saudi Arabia
80
101
Netherlands
Dominican Republic
80
86
Netherlands Antilles
Algeria
80
85
New Caledonia
Kosovo
79
100
New Zealand
Guyana
79
81
Nicaragua
Guatemala
79
66
Niger
Sri Lanka
79
69
Nigeria
Papua New Guinea
79
85
North Macedonia
Egypt
78
97
Norway
Tuvalu
78
83
Oman
Bhutan
78
83
Pakistan
El Salvador
78
80
Panama
Madagascar
77
79
Papua New Guinea
Botswana
77
82
Paraguay
Virgin Islands
77
82
Peru
India
77
80
Philippines
Kyrgyzstan
76
97
Poland
Sudan
76
94
Portugal
Kenya
76
82
Puerto Rico
Swaziland
76
81
Qatar
Morocco
75
90
Romania
Comoros
75
97
Russia
Jamaica
75
70
Rwanda
Tanzania
75
83
St Helena, Asc., Tristan
Bangladesh
74
71
Saint Kitts and Nevis
Eritrea
74
62
Saint Lucia
Zimbabwe
74
70
Saint Vincent, Grenad.
Grenada
74
87
Samoa
Nepal
73
65
Sao Tome and Principe
Cabo Verde
73
80
Saudi Arabia
Mozambique
72
70
Senegal
Burundi
72
91
Serbia
Uganda
72
83
Seychelles
Belize
72
62
Sierra Leone
Congo, Rep.
72
107
Singapore
South Africa
72
98
Slovakia
Afghanistan
72
99
Slovenia
Djibouti
72
81
Solomon Islands
Benin
71
68
Somalia
Antigua and Barbuda
71
72
South Africa
Saint Kitts and Nevis
71
62
South Sudan
Rwanda
70
97
Spain
Burkina Faso
70
79
Sri Lanka
Senegal
70
76
Sudan
Lesotho
70
89
Suriname
Angola
70
76
Swaziland
Cote d’Ivoire
70
100
Sweden
Saint Vincent, Grenad.
70
100
Switzerland
Equatorial Guinea
69
82
Syria
Gabon
69
105
Taiwan
Zambia
69
82
Tajikistan
Mauritania
69
75
Tanzania
Nigeria
69
89
Thailand
Ethiopia
69
82
Timor-Leste
Somalia
68
68
Togo
Namibia
68
85
Tonga
Yemen
68
88
Trinidad and Tobago
Guinea-Bissau
68
81
Tunisia
Togo
68
89
Turkey
Mali
67
84
Turkmenistan
Haiti
67
84
Turks and Caicos Isl.
Congo, Dem. Rep.
66
78
Tuvalu
Niger
66
72
Uganda
Dominica
66
94
Ukraine
Chad
66
89
United Arab Emirates
Sao Tome and Principe
65
100
United Kingdom
Guinea
65
98
United States
Liberia
65
89
Uruguay
Malawi
65
82
Uzbekistan
Ghana
64
82
Vanuatu
Cameroon
64
83
Venezuela
Central African Rep.
64
94
Vietnam
Sierra Leone
62
77
Virgin Islands
South Sudan
62
68
Yemen
Gambia
62
69
Zambia
Saint Lucia
62
74
Zimbabwe
Table 5. National IQs.
Table 5 shows a picture that has long been known, and it has two central points. First, the differences in cognitive performance among nations can be gigantic. Second, a clear pattern emerges that is easily understood geographically, genetically, culturally, and historically.
The range extends from 62 to 107 IQ points. The difference of 45 points corresponds to three standard deviation units. Differences of this magnitude are extremely rare to find in the social sciences, and some believe that in terms of the cognitive abilities of nations, such a difference is outright impossible. We shall show in the discussion that these values are quite realistic and that the objections are based on fundamental ignorance in several respects.
Figure 3 visualizes the maximum difference according to our nIQs. It shows two normally distributed populations of the same size with means 62 and 107 and a standard deviation of 15 points each.
Figure 3. Normal distributions. M = 62 vs. M = 107, sds = 15.
The differences are indeed gigantic. The overlap of the two distributions is 13.4 percent. That is, 13.4 percent each have an intelligence twin in the other population with exactly the same IQ. This group has a mean IQ of 84.5. The remaining 86.6 percent are worlds apart. The upper group has an average IQ of 110.5, the lower of 58.5.
Figure 3 and the values given refer to the extreme case. Figure 4 presents a more differentiated picture. This shows the frequency distribution of the nIQs.
Figure 4. Frequency distribution of national IQs.
The median is 82.9. The middle 50 percent range from 74.4 to 91.0; and 10 percent each are below and above 68.3 and 99.1, respectively.
In purely statistical terms, the picture looks quite balanced, but in terms of geographic location, genetics, and cultural development, it is extremely uneven.
At the top are East Asian countries with a national IQ of around 105, including Singapore, which owes its top position to its large population of Chinese origin. Not far behind follow the countries of Northern, Western and Central Europe and their offshoots the USA, Canada, Australia and New Zealand. Within Europe, there is a clear northwest-southeast gradient. The only countries located in other regions that score at least 90 are Israel (94), Vietnam (94), Mongolia (91), Armenia (91), Malaysia (91) and Bermuda (90). Malaysia is the only Islamic country to surpass the 90 mark, but it owes much of that to its Chinese-origin citizens, who make up 23.7 percent of the population. The only European countries below the 90 mark are Bosnia and Herzegovina (89), Montenegro (86), North Macedonia (85), Albania (82) and Kosovo (79). All of these suffered for centuries under the Islamic rule of the Ottomans. Albania and Kosovo, which come last, are still Islamic today, and Bosnia and Herzegovina is divided by an Islamic-Christian cleavage.
The 51 nations in the bottom quarter have national IQs of 62 to 74. This group is made up almost exclusively of sub-Saharan African countries and Caribbean islands with populations of sub-Saharan African descent. The only exceptions are Nepal, Belize, Afghanistan and Yemen, which occupy ranks 158, 163, 166 and 186, respectively. All of these are ethnically and culturally fragmented, and Afghanistan and Yemen have long been rocked by wars and civil strife.
The basic pattern was described half a century ago by Richard Lynn, and it is well known that the vast differences in intelligence have far-reaching consequences for the well-being of nations.
Correlates of National IQs
The paramount relevance of national IQs stems from the fact that the average cognitive abilities of the population play a role in most diverse areas of life, often an extraordinarily important one. We will illustrate this by a number of examples. This is not a comprehensive in-depth analysis, but merely a cursory demonstration of the diversity of correlates of national IQs and the strength of the relationship. We will only add a few remarks and leave the readers to draw their own conclusions.
In this section, we consider the linear relationship as measured by the product-moment correlation. As an aside, note that the issue of statistical significance is of no concern. For the large samples of nations, correlations around.20 are significant at the 1 percent level with one-tailed tests. For the vast majority of variables, p <.00001.
Table 6 shows the results on the Human Development Index 2022.
r
Human Development Index 2022
SDG
.85
Human Development Index (HDI)
.81
Life expectancy at birth
SDG3
.71
Expected years of schooling
SDG4.3
.78
Mean years of schooling
SDG4.4
.71
Gross national income (GNI) per capita
SDG8.5
.91
Inequality-adjusted HDI (IHDI)
-.86
Coefficient of human inequality
.83
Inequality-adjusted life expectancy index
.84
Inequality-adjusted education index
.88
Inequality-adjusted income index
.49
Income shares held by Poorest 40 percent
-.53
Income shares held by Richest 10 percent
-.36
Income shares held by Richest 1 percent
-.51
Gini coefficient 2010-2021
.52
Gender Development Index
.87
Human Development Index Female
.87
Human Development Index Male
.83
Life expectancy at birth Female
SDG3
.79
Life expectancy at birth Male
.72
Expected years of schooling Female
SDG4.3
.72
Expected years of schooling Male
.79
Mean years of schooling Female
SDG4.4
.78
Mean years of schooling Male
.77
Estimated GNI per capita Female
SDG8.5
.74
Estimated GNI per capita Male
-.87
Gender Inequality Index
-.70
Maternal mortality ratio
SDG3.1
-.75
Adolescent birth rate (ages 15-19)
SDG3.7
.26
Female share of seats in parliament
SDG5.5
.76
At least some second. education ages 25+ Female
SDG4.4
.74
At least some second. education ages 25+ Male
-.02
Labour force participation ages 15+ Female
-.15
Labour force participation ages 15+ Male
.76
Planetary pressures-adjusted HDI
-.59
Adjustment factor for planetary pressures
.44
Carbon dioxide emissions per capita
-.44
Carbon dioxide emissions index
.59
Material footprint per capita
-.59
Material footprint index
Table 6. Correlation with national IQs. Human Development Index 2022.
The components of the Human Development Index are strongly related to national intelligence, and except for Planetary Pressures, the relationship is positive. This also applies to the Sustainable Development Goals of the United Nations contained therein. The correlations are predominantly high to very high. Only Labor force participation age 15+ shows no connection with national IQs. We just want to touch briefly on two aspects, income inequality and the ecological footprint.
Inequality is much lower in intelligent countries than in unintelligent ones. This relationship also holds for income inequality. Contrary to popular belief, income is more evenly distributed in modern industrialized nations – which are the more intelligent ones – than in unintelligent nations.
For Planetary Pressures, the general picture is reversed. In this respect, the more intelligent nations perform worse. However, it would be a gross mistake to infer from this that people in pre-industrial cultures would have been more thoughtful and protective of their environment. We will come back to this in the discussion.
Table 7 shows the results for the Social Progress Index 2022.
r
Social Progress Index 2022
Variable
.86
Social Progress Index
.82
Basic Human Needs
B
.80
Personal Safety
B4
.76
Nutrition & Basic Medical Care
B1
.72
Water & Sanitation
B2
.68
Shelter
B3
-.75
Child mortality rate
Bx
-.73
Money Stolen
Bx
-.72
Maternal mortality rate
Bx
.69
Satisfaction with water quality
Bx
-.68
Infectious diseases
Bx
-.67
Intimate Partner Violence
Bx
.66
Usage of clean fuels and technology for cooking
Bx
-.66
Unsafe water, sanitation and hygiene
Bx
.65
Access to improved sanitation
Bx
-.64
Child stunting
Bx
.64
Access to electricity
Bx
-.58
Household air pollution
Bx
.58
Access to improved water source
Bx
-.56
Undernourishment
Bx
-.56
Diet low in fruits and vegetables
Bx
-.53
Transportation related injuries
Bx
.37
Political killings and torture
Bx
-.33
Interpersonal violence
Bx
-.26
Dissatisfaction with housing affordability
Bx
.85
Foundations of Wellbeing
F
.77
Health & Wellness
.75
Access to Basic Knowledge
F1
.67
Access to Information & Communications
F2
.56
Environmental Quality
F4
.83
Access to essential health services
Fx
.76
Secondary school attainment
.74
Internet users
Fx
.69
Access to online governance
Fx
.69
Life expectancy at 60
Fx
.67
Equal access to quality healthcare
-.65
Gender parity in secondary attainment
-.64
Population with no schooling
Fx
.64
Equal access to quality education
Fx
.57
Satisfaction with availability of quality healthcare
Fx
-.47
Lead exposure
.46
Primary school enrollment
Fx
-.45
Particulate matter pollution
Fx
.39
Mobile telephone subscriptions
-.39
Premature deaths from non-communicable diseases
Fx
-.33
Outdoor air pollution
Fx
.22
Species protection
Fx
.17
Alternative sources of information index
Fx
.71
Opportunity
O
.84
Access to Advanced Education
O4
.78
Personal Freedom & Choice
O2
.61
Inclusiveness
O3
.38
Personal Rights
O1
.78
Women with advanced education
Ox
-.72
Vulnerable employment
Ox
.69
Expected years of tertiary schooling
Ox
.68
Citable documents
Ox
.67
Access to public services distributed by social group
Ox
-.62
Early marriage
Ox
.62
Acceptance of gays and lesbians
Ox
-.62
Perception of corruption
Ox
-.55
Young people not in education, employment or training
Ox
.52
Satisfied demand for contraception
Ox
.48
Power distributed by sexual orientation
Ox
.47
Property rights for women
Ox
.42
Access to justice
Ox
.42
Equal protection index
Ox
.41
Equal access index
Ox
.38
Political rights
Ox
.37
Quality weighted universities
Ox
-.34
Discrimination and violence against minorities
Ox
.27
Freedom of peaceful assembly
Ox
.26
Freedom of domestic movement
Ox
.25
Freedom of discussion
Ox
.24
Academic freedom
Ox
.12
Freedom of religion
Ox
Table 7. Correlation with national IQs. Social Progress Index 2022.
Again, correlations are high to very high and they all show that higher national intelligence is associated with better social outcomes. The consistent picture suggests the idea that the various components are all inter-correlated and that a general factor can be identified that explains a large part of the commonality among the components. This has been shown, for example, by Kirkegaard (2014). Using factor analysis, he has extracted a strong general factor, which he calls the S-factor by analogy with the g-factor of general intelligence. As might be expected, the S-factor correlates very strongly with national IQs according to Lynn and Vanhanen (2012) and a student assessment measure according to Altinok, Diebolt, and Demeulemeester (2014), namely.86 and.87.30
Table 8 and Table 9 show the results on the Global Innovation Index 2022 and the Global Talent Competitiveness Index 2022, respectively.31
r
Global Innovation Index 2022
.88
Overall GII
.86
Human capital and research
.85
Infrastructure
.84
Knowledge and technology outputs
.82
Business sophistication
.79
Creative outputs
.74
Market sophistication
.66
Institutions
Table 8. Correlation with national IQs. Global Innovation Index 2022.
r
Global Talent Competitiveness Index 2022
.88
GTCI
.88
Grow
.88
Global Knowledge Skills
.86
Retain
.83
Vocational and Technical Skills
.80
Enable
.69
Attract
Table 9. Correlation with national IQs. Global Talent Competitiveness Index 2022.
As one would expect, the correlations are very high. It should be noted here that only 132 or 133 countries were considered and the lower intelligence range is poorly represented. Due to the range restriction, the relationship is possibly underestimated, although it is already very high.
Table 10 shows the results on the Heritage Foundation’s Index of Economic Freedom.
r
Index of Economic Freedom 2023
.63
2022 Score
.61
2023 Score
.76
Business Freedom
.68
Property Rights
.68
Trade Freedom
.66
Government Integrity
.58
Judical Effectiveness
.55
Financial Freedom
-.50
Government Spending
.45
Labor Freedom
.41
Investment Freedom
-.23
Tax Burden
.18
Monetary Freedom
.03
Fiscal Health
Table 10. Correlation with national IQs. Index of Economic Freedom 2023.
Economic Freedom indicators show a medium-high to high correlation with national Intelligence. Tax Burden and Monetary Freedom correlate weakly, and Fiscal Health shows no correlation at all. The zero correlation between intelligence and Fiscal Health seems surprising, but this may partly be due to poor data.32 The low correlation with Monetary Freedom is due to a handful of absurd outliers. We will shed a different light on the picture of Tax Burden in the next section.
Table 11 shows the results on the Democracy Index 2022.
r
Democracy Index 2022
.57
Overall Score
.62
Functioning of Government
.54
Civil Liberties
.49
Political Participation
.48
Electoral Process and Pluralism
.42
Political Culture
Table 11. Correlation with national IQs. Democracy Index 2022.
As one would expect, people that are more intelligent create more democratic structures, even if the relationship is not very strong. Due mainly to socialist and communist ideology, a number of nations lag far behind their potential. In particular, China is a negative outlier on all six variables and Russia on five. As a reminder, North Korea was generally excluded from all analyses, and for the six variables of the Democracy Index, all standardized residuals were greater than 4.9!
Table 12 shows the importance of intelligence in the Global Health Security Index 2022.
r
Global Health Security Index 2021
.76
Overall
.76
Prevention of the emergence or release of pathogens
.74
Overall risk environment and country vulnerability to biological threats
.71
Sufficient and robust health sector to treat the sick and protect health workers
.60
Rapid response to and mitigation of the spread of an epidemic
.57
Early detection and reporting for epidemics of potential international concern
.44
Commitments to improving national capacity, financing and adherence to norms
Table 12. Correlation with national IQs. Global Health Security Index 2021.
Again, the picture is unequivocal: countries with more intelligent populations are much better equipped to deal with health threats. This, however, did not prevent the more intelligent countries from being much more affected by the Covid 19 pandemic than the less intelligent ones (Becker, Kiel and Rindermann, 2023).
Table 13 and Table 14 show the results on the Global Peace Index 2022 and the more differentiated Positive Peace Index 2022.
r
Global Peace Index 2022
.52
Overall GPI 2022
.63
Safety and Security
.42
Ongoing Conflict
.11
Militarisation
Table 13. Correlation with national IQs. Global Peace Index 2022. Poling by desirability.
r
Positive Peace Index 2022
.79
Acceptance of the Rights of Others ARO
.86
Equitable Distribution of Resources EDR
.66
Free Flow of Information FFI
.76
Good Relations with Neighbours GRN
.86
High Levels of Human Capital HLHC
.70
Low Levels of Corruption LLC
.83
Sound Business Environment SBE
.73
Well-Functioning Government WFG
.71
ARO: Exclusion by socio-economic group
.89
ARO: Gender Inequality
.37
ARO: Group grievance
.88
EDR: Inequality-adjusted life expectancy
.75
EDR: Access to public Services
.67
EDR: Equality of opportunity
.79
FFI: Individuals using the Internet
.38
FFI: Quality of information
.29
FFI: Freedom of the Press
.67
GRN: External Intervention
.66
GRN: International tourism
.52
GRN: Law to support equal treatment of population segments
.85
HLHC: Healthy life expectancy
.79
HLHC: Researchers in R&D
.59
HLHC: Share of youth not in employment, education or training
.69
LLC: Control of corruption
.68
LLC: Public sector theft
.60
LLC: Factionalised elites
.80
SBE: Financial Institutions Index
.77
SBE: GDP per capita
.75
SBE: Regulatory Quality
.79
WFG: Government effectiveness
.72
WFG: Rule of law
.53
WFG: Government openness and transparency
Table 14. Correlation with national IQs. Positive Peace Index 2022. Poling by desirability.
Both indices make it clear that the conditions of life in more intelligent countries are much more conducive to peace than in unintelligent countries. In the Positive Peace Index, the correlations are almost all high to very high. Only Militarisation shows no correlation with intelligence. Figure 10 at the end of the following section shows that the importance of intelligence has been underestimated for some Positive Peace variables because the linear model is not optimal.
Finally, in Table 15 we look at the World Happiness Report 2023.
r
World Happiness Report 2023
.74
Life Ladder
.88
Log GDP per capita
.87
Healthy life expectancy at birth
.76
Social support
-.63
Negative affect
-.46
Perceptions of corruption
.39
Freedom to make life choices
.21
Positive affect
.01
Generosity
Table 15. Correlation with national IQs. World Happiness Report 2023.
The core variable Life Ladder shows that people in more intelligent nations are more satisfied with their current life situation than people in unintelligent nations. Who would be surprised? Two comments seem worthwhile. First, negative affect shows a much stronger correlation with intelligence than positive affect (-.63 vs..21). The low correlation for positive affect is primarily due to the well-known idiosyncrasy of Latin America. „The affective state – in particular positive affect – is outstandingly high in Latin America; as a matter of fact, Latin American countries usually show up in the top positions when rankings are elaborated on the basis of the experience of positive affect“ (Rojas, 2018, p. 118). In the 2023 report, Latin American countries scored a mean of.77 and a minimum of.68 on the 0-1 scale, while the rest of the countries averaged.63. Second, the Generosity33 variable is one of the very few that shows no relationship with intelligence. It also shows no relationship with the Life Ladder (.08) and is out-of-place in the concept of the World Happiness Report.
Non-linear Relationships
In the previous section, we considered linear correlations. However, for some variables, the relationship is obviously non-linear and the linear model underestimates the true commonalities, in some cases considerably. In the following, we consider the special case described by the Threshold Model of formal-operative Intelligence. A few examples are illustrated by Figure 5 to Figure 9. In each case, intelligence is plotted on the X-axis.
Figure 5 depicts the relationship between intelligence and the Citable Documents variable from the Social Progress Index 2022, which refers to scientific publications and is defined as Articles, Reviews and Conference Papers per 1,000 Population (Harmacek, Krylova, and Htitich, 2022).
Figure 5. Intelligence and Citable Documents (Social Progress Index 2022).
Citable Documents is a textbook example of our Threshold Model of formal-operative Intelligence. To be able to produce scientific publications, a minimum level of formal-operative intelligence is required. Below a certain threshold – in this case below a national IQ of 85 – scientific work is hardly possible. Above the threshold, the output of scientific publications increases linearly as the intelligence of the population increases.
Disregarding non-linearity, the product-moment correlation in this example is.71 and this corresponds to a variance explained of 51.8 percent. This is already quite a lot, but our threshold model boosts the correlation to.81 and the variance explained to 66.3 percent. This example demonstrates impressively that the customary application of the linear model can massively underestimate the true association.
Figure 6 shows the Maternal Mortality Rate according to the Human Development Index 2022.
Figure 6. Intelligence and mortality rate.
The Maternal Mortality Rate shows almost the same picture as the Citable Documents, except that the plateau is now in the upper intelligence range and the slope indicates a negative correlation with intelligence. That is, as intelligence increases, mortality decreases and above a certain threshold (81 in this case) it plays almost no role at all. Compared to the linear model, the correlation in the threshold model jumps from -.70 to -.79 and the variance explained from 49.3 percent to 62.7 percent.
Figure 7 depicts the relationship between intelligence and Gross National Income per capita (GNIc; 2017 PPP $) according to the 2022 Human Development Index.
Figure 7. Intelligence and gross national income per capita.
Gross National Income per capita shows almost the same picture as the Citable Documents in Figure 5. We will come back to this important variable in the discussion. Here we merely note that compared to the linear model, the threshold model raises the correlation from.71 to.75 and the variance explained from 50.2 to 55.9 percent. The threshold is 83.
Figure 8 illustrates the association between intelligence and Government Integrity according to the Index of Economic Freedom 2023.
Figure 8. Intelligence and government integrity.
Again, the familiar picture emerges. By accounting for non-linearity, the correlation increases from.66 to.72 and the variance explained from 43.4 to 52.0 percent. The threshold is 83.
Figure 9 highlights another variable from the Index of Economic Freedom 2023, namely Tax Burden.
Figure 9. Intelligence and tax burden.
The relationship is much less strong than in the previous examples. We choose this variable for the following reason: in the linear model, the correlation is -.23 and the common variance is 5.3 percent. Presumably, some would discard the relationship as negligible. However, in the threshold model, the correlation climbs to -.45 and a shared variance of 20.0 percent cannot be dismissed as unimportant.
Table 16 summarizes statistical parameters of the examples illustrated in Figures 1 and Figure 5 through Figure 9 as well as the Total Fertility Rate, which we will consider at the end of this article (Figure 12). In Table 16, Corr denotes correlation, and Var% denotes the percentage of variance explained. In both cases, l denotes the linear relationship and nl the nonlinear one. T denotes the threshold and N the number of nations.
Corr
Var%
Variable
l
nl
l
nl
T
N
Freedom from Corruption (CPI 2022)
.63
.68
39.6
46.9
83
180
Citable Documents (SPI 2022)
.72
.81
51.8
66.3
85
169
Maternal Mortality Ratio (HDI 2022)
-.70
.79
49.3
62.7
81
182
GNIc (2017 PPP $) (HDI 2022)
.71
-.75
50.2
55.9
83
189
Government Integrity (IEF 2023)
.66
.72
43.4
52.0
83
182
Tax Burden (IEF 2023)
-.23
-.45
5.3
20.0
88
175
Total Fertility Rate (Our World in Data)
-.74
-.78
54.8
60.4
89
189
Table 16. Correlation with national IQs. Linear versus Threshold Model.
The examples we illustrated are just the tip of the iceberg. In fact, the scope of the Threshold Model of formal-operative Intelligence is much broader. Figure 10 presents additional examples in a bar chart. The left subbar shows the percentage of variance explained by the linear model, and the right subbar shows the percentage gain in the threshold model. This list is, of course, not exhaustive. First, it covers only variables that we selected for this article. Second, not all variables are included, although the threshold model also yields a gain there, mostly small.
Figure 10. Variance explained. Linear and nonlinear surplus.
The attentive reader may miss some variables from the Global Talent Competitiveness Index and the Global Innovation Index. It is just in these areas that one would expect a crucial impact of formal-operative intelligence. Here, however, it must be recalled that the samples include only 132 or 133 countries and that many from the lower intelligence range are not represented at all. In a certain sense, the basic idea of the threshold model was applied here and the lower intelligence range was thinned out.
Overall, our consideration of the Threshold Model of formal-operative intelligence should have made it clear that the importance of intelligence is much greater than many believe.
Discussion
If one had to summarize our empirical findings in three words, it would be: Almost nothing new. The only exception is the non-linear effects of intelligence. These are probably known to few people, at least not from the theoretical perspective of our Threshold Model of formal-operative Intelligence. The fact that there is nothing new about almost all other aspects is by no means boring. Quite to the contrary, it is of extraordinary importance. It demonstrates that the central findings of psychometric intelligence research hold unchanged.
The phenotypic intelligence of nations can be measured with very high reliability and national IQs have exceptionally high validity. Although IQ scores have risen massively since the last century, the relative order of nations shows high temporal stability. Perhaps the most important point is the very high variability among nations, which underlies a rather straightforward pattern that has evolved historically. Since the cognitive abilities of the population affect almost all areas of life, the extreme variability leads to extreme inequalities in a wide variety of sub-areas of life. Because of this inescapable fact, the topic of intelligence is unfortunately continually drawn into ideological disputes.
Reliability
The first important result is the well-known fact that, despite all claims to the contrary, the average cognitive abilities of nations can be estimated with high reliability. The five datasets that are the starting point of our analyses correlate strongly with each other, so that a highly reliable measure of national intelligence can be derived.
Of particular importance is the fact, also well-known, that the estimates from psychometric intelligence research and international student assessment studies are in excellent agreement. This is not due solely to the fact that the datasets partially overlap. The central reason is that student performance depends to a very large extent on intelligence. Other factors play a role in student assessment tests, of course, but at the highly aggregated level of nations, intelligence is ultimately the decisive factor.
The paramount importance of intelligence is impressively demonstrated, for example, by the PISA studies. The tests in Reading, Mathematics and Sciences refer to completely different subject areas, but nevertheless they yield almost identical gradations at the country level. Education researchers think they are measuring three quite different abilities, but PISA delivers the same result three times over, and this correlates extraordinarily highly with our national IQs. What matters is not what educational researchers and their political principals intend. What matters is what tests actually measure. PISA, TIMSS & Co. measure student performance on cognitively demanding tasks, and this is crucially dependent on intelligence. Thus, PISA is a pretty good example of Spearman’s (1927) principle of the indifference of the indicator in measuring general intelligence.
Volkmar Weiss has noted with amusement in this context: „Who among the educational economists would ever have thought it possible [that the tests essentially measure intelligence]? One can only hope that their ignorance will be preserved for them and the governments that pay them, because as soon as they would comprehend what they are actually measuring, it is to be feared that such assessments as PISA would no longer be funded“ (Weiss, 2012, p. 201-203).
Our positive assessment of reliability does not mean that the situation is perfect. Although the database has improved continuously, there are still large gaps in the middle and especially in the lower intelligence range, and enormous research efforts are still warranted here. However, one can assume with great confidence that the errors are not very large. How else could it be possible that national IQs correlate so closely in a systematic way with so many variables from a wide variety of life domains? The outlier analyses we have conducted in this context do not indicate that serious errors are due to a lack of data. Apart from the exotic North Korea, which we generally excluded, large outliers are found here and there for China, Russia, Afghanistan, Syria, Yemen, or oil-producing countries or tax havens or small tourist islands that are dependent on external intelligence, Western technology, and capital. This easily understandable pattern has already been noted by Lynn and Vanhanen (2012).
Temporal Stability of National IQs
The issue of stability of national intelligence has two aspects, an absolute and a relative one. In terms of absolute cognitive achievement levels, the 20th century witnessed a phenomenal, unprecedented revolution. The triumphant advance of formal-operative intelligence, which is behind the Flynn effect, has elevated humanity to a qualitatively higher level of development. In terms of the relative position of nations, things look quite different.
When Lynn and Vanhanen published their groundbreaking book „IQ and the Wealth of Nations” in 2002, empirical data were available for only 81 countries. Based on geographic neighborhood, they estimated the national IQ of additional countries, so that all 185 nations with populations greater than 50,000 were included. The correlation between our estimates and Lynn and Vanhanen’s estimates is.95 for the 81 countries with actual empirical data. This is highly remarkable because of the range restriction in the lower intelligence segment. The comparison for the entire set of nations is even more impressive. Although empirical data were not available for more than half, the correlation between Lynn and Vanhanen’s and our national IQs is.94.34 This shows, on the one hand, that the relative position of the countries is extraordinarily stable and, on the other hand, that the estimates based on geographic neighborhood are surprisingly good in this respect, despite all their shortcomings.
Despite the Flynn effect, what Richard Lynn already noted in the 1980s still holds true: „European nations... had an average IQ of 100, Northeast Asian nations had an average IQ of 106, South Asians and North African nations had an average of 84, and the sub-Saharan African nations had an average IQ of 70“ (Lynn, 2018, p. 256). With the Flynn effect, cognitive levels have risen, but the relationship between nations has largely remained the same. Nonetheless, there were also a few spectacular shifts in the 20th century. China and Korea lagged far behind the leading Western nations in 1900; today they are five points ahead. Some other countries also made impressive improvements. For example, Finland, Russia, Spain and Portugal are among the big winners of the 20th century.
Variability among national IQs
An extraordinarily important point is the enormous variability in cognitive capabilities among nations.
In Figure 3, we have illustrated the extremes, ranging from 62 to 107, three standard deviations apart. While in the countries at the top, a considerable proportion of the population is capable of high-level formal-operative thinking, in the countries at the bottom, the lion’s share is in the lower range of concrete-operational thinking or even at the preoperational stage.
The interquartile range extends from 74.4 to 91.0, meaning that the top-quartile countries are separated from the bottom-quartile countries by more than 16 IQ points. In the bottom quarter, a high proportion of the population does not reach the developmental height of 12-year-old children in the Western world.
Very large differences between nations are found for many characteristics and often they are hardly worth mentioning. With regard to intelligence, things look different. Intelligence is by far the most important human trait of all, and it has an impact on countless other areas of life, in some cases quite decisively. In addition, the distribution of cognitive abilities across nations is not random, but has a distinctive pattern that is closely related to eye-popping ethnic differences.
Geographic, Historical/Cultural, and Genetic Dimension of National IQs
We do not have IQ scores from previous centuries and millennia, but today’s national IQs have a strong tie to our past.35 To shed light on the global pattern of intelligence, in Figure 11we look at the frequency distribution of national IQs, broken down by four major groups that can be clearly differentiated based on geography, history/culture, and genetics. The yellow bars include Chinese, Japanese, and Koreans. The green bars include Europe and its Western offshoots USA, Canada, Australia and New Zealand. The gray bars include sub-Saharan Africa and Caribbean islands with a large Black majority. The blue bars mark the remaining nations.
Figure 11. Frequency distribution of national IQs; four main groups.
The figure shows a clear pattern with only a few overlaps. Anyone who has read more than twenty (good) books on world history, who has understood the basic principles of evolutionary theory and who has taken note of the groundbreaking findings of genetic research36 would say: So what? What else would one have expected?
The civilizational advancement of mankind has never been evenly distributed. On the contrary, almost everything that has contributed to the progress of mankind originated in a few regions of the earth and the carriers were radically different in genetic terms from the lagging populations. What we see in Figure 11 is the footprint of human development in historical times and the differential ascent of peoples on Piaget’s stages of cognitive development.
The first fundamental leap was the ascent from the preoperational to the concrete-operational stage during the Achsenzeit. The term Achsenzeit was coined by Karl Jaspers (1960).37 The Achsenzeit covers the period from 800 to 200 BC. During this epoch, the decisive foundations of humanity’s cognitive development were laid. Five cultures were involved, namely the Greek-Hellenistic, Judaism, Persia, India and China. In these cultures, the leap from the pre-operational to the concrete-operational stage took place. In the case of the Greeks, especially the Hellenists, it even reached the formal-operative stage in some narrowly defined areas. The second fundamental leap, which changed the world to a much greater extent, was the ascendance to the formal-operative stage. This had its origin solely in Europe, and by far the greater part occurred in the tiny northwestern region, which Nial Ferguson, following Charles Murray (2004), describes as follows: „The home of an astonishingly high proportion of the outstanding minds – about 80 percent – was a geographic hexagon with the vertices Glasgow, Copenhagen, Cracow, Naples, Marseilles, and Plymouth, and almost all the other key figures of the Scientific Revolution were born within 150 kilometers of this core area“ (Ferguson, 2013, p. 117). Gradually the whole world was drawn in, and Figure 11 essentially shows the extent to which present-day nations have advanced to the formal-operative stage.
In this respect, we find a straightforward four-way split.38 At the top are the East Asians, Chinese, Japanese and Koreans. In second place comes Europe with its Western offshoots. At the bottom are sub-Saharan Africa and Caribbean nations with Black majorities; and in third place are the remaining nations of this world. This broad division is geographically clear-cut, but it is genetically and culturally shaped to an even greater extent. Singapore, the Western European offshoots and the Blacks of the Caribbean show that it is the people and their developmental history that matter more than the geographical coordinates.39
East Asians are about five IQ points ahead of the leading European nations. This difference is quite substantial. However, the picture is distorted by uncontrolled mass immigration to Western European countries. An instructive example is Germany in PISA 2018. In the focus domain of Reading, immigrants reduced the score by 3.1 IQ points. In the overall sample, Germany is behind Macau, South Korea, Japan, and Taiwan (99.7 vs. 103.8, 102.1, 100.6, 100.4). In the subset of „non-immigrants”, however, Germany is ahead of South Korea, Macau, Taiwan and Japan (102.8 vs. 102.3, 101.8, 100.7; no data on Japan). In fact, the effect is even stronger, as the share of immigrants is underestimated by the OECD’s whitewashing definition. The differences between native Germans and East Asians are small, but millions of immigrants from Balkan states, Islamic countries and sub-Saharan Africa press down the overall level, and this trend will inevitably intensify. The situation is similar in most Western European countries. Through dysgenic migration policies, Western Europe is promoting its own decline.
As already noted following Table 5, there is a strong northwest-southeast gradient in Europe. In the Balkans, which first languished under the Byzantine Empire and then suffered under the Ottoman yoke for centuries, some countries are ten, fifteen or even twenty points below the leading Western countries. These are the green bars that extend into the blue middle range and dilute the otherwise clear division.
The few countries from the blue middle group that achieve a national IQ of at least 90 and thus join the lower European range are, as mentioned, Israel, Vietnam, Mongolia, Armenia, Malaysia, Bermuda. Israel is strongly shaped by Europe,40 Armenia is Christian Orthodox, and Bermuda is strongly U.S. shaped. Vietnam and Mongolia are bordering on China, and Malaysia owes its good performance to its large population of Chinese origin.
The lower intelligence range is almost entirely occupied by Blacks. Only Bangladesh, Nepal, Belize, Afghanistan and Yemen mix in with a national IQ below 75. The gray bars that make it into the middle, blue range with a score of at least 80 belong to Trinidad and Tobago, Netherlands Antilles, Turks and Caicos, Bahamas, Seychelles and Barbados. With the exception of the tourist islands group Seychelles, these are Caribbean islands under strong Western influence.
Of the blue group from the middle intelligence range, we want to touch on only two regions. One is the Near and Middle East and eastern North Africa. In the Fertile Crescent lies the cradle of agriculture and husbandry, in Mesopotamia around the Euphrates and Tigris rivers and on the banks of the Nile the first civilizations emerged, in the Near East the Jewish, Christian and Islamic religions arose, and in Persia Zoroastrianism. Under the all-encompassing reign of Islam, this region has not yet accomplished the leap to the formal-operative stage. The situation is similar in India. During the Achsenzeit, the northern part with the great river valleys of the Indus and Ganges was among the first great civilizations, but today the ethnically and culturally extremely heterogeneous subcontinent is lagging far behind.
Compared to the Achsenzeit, the following picture emerges. In the West, the center of gravity shifted to northwestern Europe and from there elevated the entire world to a higher level, in particular spawning four offshoots that stand on top today. In the East, China has expanded and radiated to Japan and Korea in particular, but it was only via its encounter with Western civilization that the region was awakened from centuries of lethargy and now stands at the pinnacle of world intelligence. Most of the erstwhile axis of civilization is merely in the lower range of formal-operative intelligence. This is also true for almost all other non-Black nations. Only Black Africa, which had the misfortune of being touched very late by Western civilization, and most of its involuntary Caribbean offshoots are way behind in their cognitive development.
The enormous shifts in world structure have been accompanied by enormous changes in gene pools, about which we are beginning to get a picture thanks to the amazing advances in genome-wide research. We cannot go into detail and confine ourselves to a few brief remarks. The present population of Greece has only partial overlaps with the ancient Greeks, who made the step to the concrete-operational stage and laid the indispensable foundation for the intellectual development of Europe. Europe, which opened the way to the formal-operative stage, emerged only in the course of millennia of migrations, extinctions and intermixtures; it was not until the 2nd millennium AD that today’s populations became established. Today’s inhabitants of Turkey have not a trace to do with the early Anatolian farmers and the flourishing sites of the East Aegean culture; they arrived in this region only a thousand years ago. The ancient North Indian civilizations were the work of Aryan peoples who no longer exist today. The entire American continent has genetically hardly anything to do with the pre-Columbian world. The same is true, for example, of Australia and New Zealand. Sub-Saharan Africa has experienced tremendous genetic shifts until recent times, but essentially only among Black peoples.
The gigantic cognitive differences between racial or ethnic groups are not the work of intelligence researchers. They are empirical realities that have emerged in human evolution due to extremely diverse environmental conditions and differential selection that has perpetrated its work over a few, dozens, hundreds and thousands of generations.
In earlier times, the bearer of bad news was killed. Such brutal methods have gone out of fashion in formal-operative societies. But not a few cry out for censorship and interdiction. We will come back to this shortly.
Slavery and Colonialism
Due to the political explosiveness, which blocks some areas of intelligence research, even makes it almost impossible, we have to make a brief detour to slavery and colonialism.41
Almost all earlier societies practiced slavery. Because of their low cognitive and moral development, slavery appears to people at the preformal stage as a most natural course of action.42 Sub-Saharan Africa is no exception. For millennia, Blacks enslaved other Blacks. Centuries before the first Europeans set eyes on the shores of sub-Saharan Africa, the slave trade was the preferred business model of Blacks in their contacts with the Islamic world. It is estimated that up to 15 million Blacks were trafficked to the Arab world and India. In later contact with Europeans, Black Africans continued to expand their lucrative business model. Due to the biological barrier, Europeans could not penetrate into the interior of sub-Saharan Africa for centuries. Slave hunting and the slave trade remained solely in the hands of Blacks until the human commodity was transferred to the ships. Over the business model of the Black Africans lies a thick mantle of silence. As people in the Western world gradually ascended to the formal-operative stage, resistance to slavery rose. It was the Western world – and the Western world alone – that fought and eventually abolished slavery in the face of fierce opposition from Blacks and also from the Islamic world.
The abolition of slavery is one of the greatest humanitarian achievements in human history.
Although many more Blacks were deported to the Islamic world and India than to the Americas, one does not see any Blacks there today. The Black slaves were not led peacefully back to their continent of origin, no, they were systematically prevented from procreating, which ultimately amounts to genocide.43 Over the suffering of the millions of Black slaves in North Africa and Asia and over the millions never-born Blacks lies a thick mantle of silence. On the American continent, the Blacks intermixed with other ethnic groups or form independent countries to this day. It is estimated that 600,000 Blacks were deported to the USA.44 Their descendants number 47 million today, which is about 14 percent of the U.S. population. Due to genetic admixture with Whites and centuries of living in the more advanced Western culture, the IQ of US Blacks today is 85. This puts them far above the descendants of slave hunters, slave traders, slave owners and those internally enslaved in sub-Saharan Africa. It is fair to say that U.S. Blacks are among the great winners of the West’s ascent to the formal-operative stage, or, in the words of Gilley (2020, p. 4): „To be black in America is, historically speaking, to have hit the jackpot.”
Lest it be forgotten: Europeans were also enslaved for centuries and more than a million were deported to Islamic countries.45 Over this, too, lies a thick mantle of silence.
Because of the almost insurmountable barrier of the Sahara Desert and because of the permanent threat of deadly pathogens to immunologically unadapted foreigners, sub-Saharan Africa had the disadvantage of being largely cut off from the cultural development of the rest of the world until recently. This is especially true with regard to colonization by Europeans. Until the development of modern medicine, sub-Saharan Africa was the White Man’s Tomb, and through loose contacts in the slave trade alone, Blacks could hardly experience cultural progress. It was not until the great wave of colonization that began in the late 19th century that a steep upswing took place in infrastructure, the economy, health care, and also in schooling, which had not existed before. In the 1960s, sub-Saharan Africa had a higher per capita income than Asia. With independence, Blacks self-destructed their good prospects and today they lag far behind.46
Colonization was brutal in many aspects and unacceptable by our nowadays standards. But all those who judge the world from their own moral point of view should follow Darlington’s thought experiment: „Let us first imagine what would have happened without this ruthless advance [of the European colonizers; R.H.]. The condition of those continents could hardly have changed in the past 500 years. China would still be kowtowing to the Son of Heaven. Japan would still be in the cage of the Schogune. India would still be the victim of war-mongering Rajahs. And over the roads to Tripoli, Khartoum, and Zanzibar, Arabs would still drive their caravans of castrated slaves at considerable profit. Flotillas of cannibals would block the rapids of the Congo. And on their distant islands, Maoris and Melanesians still lived as man-eaters“ (Darlington, 1980, p. 370). Not to leave out the New World, Darlington could have also mentioned the repugnant bloodthirsty human sacrifices of the Aztecs. And he could also have mentioned the countless primitive peoples who had not even reached the developmental level of modern 7-year-olds. – All of these worlds no longer exist. It is very unlikely that any critic of colonialism would want to live in such worlds.
We are not glorifying colonization. Colonization is a historical fact that marks a certain period of human development and was found in all parts of the world. The people who shaped this epoch were at a completely different stage of anthropological development and they never had the possibility to see the world as we do today. We cannot undo history, for better or for worse; we can only strive to understand history and learn something from it.
A key lesson on this topic is: Slavery, colonization, war, violence, ruthlessness were not unique characteristics of Western Europeans. These were universal characteristics of earlier times, and this applies to the colonized peoples far more than to the Western colonizers. The indisputable fact is:
Western colonization elevated the entire human race to a higher level of anthropological development.
Although intelligence levels all over the world are much higher today than they were a short time ago, gigantic differences still exist between peoples and nations. And these differences have tremendous impact in a wide variety of areas of life.
Validity, Correlates of Intelligence
Our examination of correlates of intelligence has shown unmistakably that national IQs have extraordinary validity. National IQs correlate with a wide range of variables from different domains of life.
According to a rough rule of thumb by Cohen (1988), a product-moment-correlation of.10 is considered a weak effect,.30 a medium effect, and.50 a strong effect. Measured against the usual relationships in the social sciences, the effect sizes of national IQs are mostly high, often very high, and occasionally extremely high. Weak effects are hard to find, and it is not easy to find relevant variables that do not correlate with the average cognitive abilities of nations.
The direction of the relationship is exactly as one would expect from a theoretical perspective. What we value positively correlates positively with intelligence. There are very few exceptions, and these are easy to understand. In general, we can say:
National IQs are an excellent predictor of the well-being of nations.
The exceptionally high validity of national IQs has long been recognized. Already Lynn and Vanhanen (2006, 2012) have compiled a wealth of evidence, which has been extended by Lynn and Becker (2019). In addition, there is a large body of further empirical evidence. By accounting for nonlinear relationships, we have shown that the importance of national intelligence in some domains is greater than has been known.
We want to reemphasize that we are not looking at cause and effect issues. Correlations, in and of themselves, do not allow for causal inferences. Often the effect is likely to go both ways, and usually national intelligence is embedded in a more or less complex network of variables. Analyzing such networks is beyond the scope of this paper. A couple of such analyses can be found, for example, in Lynn and Vanhanen (2006, 2012), Lynn and Becker (2019), and Rindermann (2018).
A Dark Spot of Intelligence
Among all the different areas we have considered so far, there is only a single one worth mentioning that is negatively related to intelligence (we will consider another case at the end of this article). The dark spot is the ecological footprint, which is one of the greatest menaces of all. There is no doubt that the enormous expansion of possibilities that have been unlocked by the rise of formal-operative thinking has resulted in environmental burdens that exceed anything ever seen before.
However, it would be a gross mistake to believe that humans were any better in earlier times. Around the globe, they have radically transformed the flora, turning fertile regions into barren stretches of land and vast deserts. Wherever humans have come, they have wiped out entire animal populations. With their actions, they also made an impact on the climate. Humans have deluded themselves into thinking that they were preserving nature, but one after another society has collapsed because they destroyed their very foundations of life. If in some respects the ecological harms were less than they are today, it is because both the populations and the technological capabilities were several orders of magnitude smaller.
These brief remarks should not be misunderstood as an indictment of man, nor as a romanticizing of nature, nor as a doomsday prophecy. Life inevitably means modification of nature. Nature is not there to make life pleasant for man or any other living beings. Life requires at the same time the utilization of natural conditions and struggle against their resistances.
Intelligence and the Wealth of Nations
Another variable that deserves special attention is Gross National Income per capita (GNIc). Outside of intelligence research, many would probably argue that this, or the closely related Gross Domestic Product per capita (GDPc), is the most important variable of all.47
As we illustrated in Figure 7, GNIc is a typical threshold variable. By accounting for nonlinearity, the variance explained increases from 50.2 to 55.9 percent. This in itself is quite remarkable, but, as with other variables, there are some outliers that weaken the correlation. The largest positive standardized residuals are for Liechtenstein (6.5), Qatar (5.4), Kuwait (3.1), Luxembourg (3.0), Brunei (2.9), United Arab Emirates (2.7), and Saudi Arabia (2.6). At the opposite end is China with a residual of -3.2.
The positive outliers have very small populations48 and/or owe their extraordinary wealth to fossil fuels that have rested in the earth for many millions of years. The dwarf state of Liechtenstein and the small state of Luxembourg have very high intelligence by international standards, but they owe their wealth, which goes far beyond that, to sophisticated financial schemes that not a few would consider dubious. China, at the other end, has enjoyed fantastic economic growth in recent decades, but it will be a while before its per capita income matches the level of its extraordinarily intelligent population.
If we remove the outliers, the nonlinear correlation soars to.88, which means that the Threshold Model of formal-operative Intelligence explains 77.5 percent of the variance in GNIc, or more than three quarters. This is extraordinarily high and the conclusion is:
Anyone talking about GNIc, GDPc, or similar variables is implicitly talking about the cognitive abilities of the population.
What we measure as economic performance is not solely the result of material resources, physical labor and capital – a very large part derives from the cognitive abilities of people capable of formal thinking. Very high economic development is not possible at all without formal intelligence; or, to put it another way, formal-operative intelligence is a necessary condition for very high economic development. This necessary condition can be fulfilled in two ways, firstly by high intelligence of the population and secondly by external intelligence.
Thanks to their abundance of natural resources, the economic performance of some countries is much higher than the intelligence of their populations would predict. Their immense wealth does not grow by itself from their natural treasures. Left entirely to themselves, those countries would not even be able to prospect for the raw materials, let alone extract and process them, and they would have no idea what to do with them. The resources would not be treasures, but simply irrelevant dreck. Only the demand from more developed countries, only their knowledge and the superior technological and organizational abilities, which can spring only from formal thinking, make treasures out of the dreck.
To tackle outliers, many researchers use the logarithm of GNIc. For the full sample, the logarithmic model is much better than the linear model and also better than the threshold model (.80 vs..71 and.75). However, when outliers are removed, the threshold model is clearly better than the logarithmic (.88 vs..82).
Nonlinear Relationships
A distinct feature of our work is the focus on nonlinear relationships. Demonstrating that the relationship is nonlinear for a number of variables is not a shortcoming. On the contrary, this shows that the validity of national IQs is higher than has been thought in some areas. It is to be expected that some achievements can only be attained when a minimum of formal-operative thinking is present and that performance increases with increasing formal-operative intelligence. This is just what is modelled by the Threshold Model of formal-operative Intelligence. Unlike purely statistical attempts to get a handle on nonlinearity, the threshold model rests on a well-grounded theoretical foundation.
A threshold relationship has an important implication that should be pointed out. A number of countries could increase their national IQ by 10, 15, or 20 points and would still remain at the preformal level. Thus, even a substantial increase in cognitive ability would have no impact on the second variable. In these cases, the problem of weak data for nations in the lower intelligence range is of no significance. Increasing the score from 60 to 80 would not change anything.
„Racism! Racism!”-Screaming and Censorship
As mentioned in the introduction, research on national IQs has been accompanied by cries of „Racism! Racism!“ from the very beginning, and demands for censorship and interdiction have been raised again and again. That this is still the case today is shown by the following two examples.
The first is by Ebbesen (2020). The article is part of a veritable shitstorm and scandalous politically motivated censorship against an article by Clark et al. (2020).
The author starts with „IQ scores are a poor measure of cognitive ability“ – what on earth would be a useful measure of cognitive ability if not psychometric IQ scores? Right in the second sentence, he swings the racism club: „Biased and incorrect estimates of average IQ in non-European populations historically was – and still is – a core component of scientific racism within psychology.“
His fury is ignited by the very low scores of sub-Saharan Africans. Referring to the Diagnostic Statistical Manual of Mental Disorders (DSM), he states „Within a comparable population, as a rough indicator, extremely low IQ scores can be a sign of clinically significant cognitive impairments, such as intellectual disability … In DSM-IV (APA, 1998), intellectual disability was partly diagnosed by an IQ score of below 70 (i.e. two standard deviations below the mean of 100 in the population)”. He then points to some very low national IQs and concludes „These estimates would seem to suggest that a majority of the population in these countries are moderately, severely or profoundly cognitively impaired … This notion is incompatible with psychological science and there is no doubt that these estimates are wrong … the national IQ of African countries … is 24.4 points lower than the national IQ of European countries … This is a huge mean difference (~1.6 standard deviations), similar in magnitude to the the DSM-IV diagnostic criterion for intellectual disability (2 standard deviation). There is no doubt that these estimates of national IQ for African nations are incorrect.”
One might think that Ebbesen never heard of the Flynn effect. Otherwise, he would know that the national IQ in Western industrialized nations at the beginning of the 20th century was about 70. No, the average citizen in Western countries in 1900 was not a case for the psychiatrist.
One might also think Ebbesen never heard of the Global Learning Crisis. Student assessment studies have powerfully demonstrated that in many countries a high proportion are not capable of formal-operative thinking at all, or are only rudimentarily capable. We recall the quote „hundreds of millions of children finish schooling lacking even the basic literacy and numeracy skills of the nineteenth century“ (Pritchett, 2013, p. 14). In many countries, cognitive levels are considerably lower than, for example, in the United States, England, and Germany in 1900. National IQs below 70 are far from unusual and, by themselves, are not indicative of mental retardation.
To all appearances, Ebbesen also did not understand the criteria of the DSM. The crucial point was elaborated by Warne (2022, p. 17) as follows: „According to the fifth edition of the Diagnostic and Statistical Manual for Mental Disorders (American Psychiatric Association, 2013, p. 37), a person cannot be diagnosed with an intellectual disability without meeting three criteria: (1) a deficit in general mental ability, (2) impairment in functioning compared to one’s peers, and (3) onset during childhood. A low IQ score is only relevant for criterion (1), and so a person — or an entire group of people — cannot be judged to have an intellectual disability on the sole basis of a low IQ score. All three criteria must be met … Even if the average IQ for a nation really were extremely low by Western standards, it is not logically possible for a substantial portion of a nation’s citizens to have an intellectual disability. This is because the second criterion requires a person’s functioning to be impaired compared to that of their peers. By definition, a nation’s population of people is a set of peers, and the people within that population cannot logically have an impairment compared to their own functioning.”49 The essence of the matter expressed differently: The least developed countries are orders of magnitude less complex than modern industrial societies. In such simple societies, people can do without formal-operative thinking, and an IQ of 60, 50 or even less is quite sufficient. As recently as 200 or 150 years ago, no country in the world – measured by our standards – would have reached an IQ of 70. None of these societies was cognitively impaired.
Another knowledge gap is evident from the statement „It is also impossible that the average IQ of African nations is ~1.6 standard deviations below the average IQ of European nations … presenting such low IQ estimates is equivalent to claiming that African adults have the cognitive ability of an average 11-year-old European child. This notion is incompatible with psychological science.“ No, this is not incompatible with psychological science; on the contrary, it is in full agreement with cross-cultural Piagetian developmental psychology. Ebbesen has apparently never heard of it and he obviously has not the slightest idea of the difference between developmental height and developmental breadth.50
Based on his fundamentally defective reasoning, Ebbesen concludes his article with the words „The estimates of cognitive ability presented by Clark et al. (2020) are so flawed that it is impossible to draw any conclusions from their analysis. The paper should be retracted“. He thus contributed his part to the witch-hunt and the scandalous censorship.
Our second example is the article by Rebecca Sear (2022), which is intended as a fatal blow to Becker’s NIQ database.51 Her starting point is the statement „IQs below ~70-75 are considered to indicate intellectual disability (American Psychological Association, 2013) and it is wholly implausible that an entire world region should, on average, be on the verge of intellectual impairment.“ What was said about Ebbesen is also true of Sear. That is, she seems to have no proper understanding of the Flynn effect, of international student assessment studies, of the DSM, and of cross-cultural Piagetian developmental psychology.
An interesting aspect is in the statement „most countries appear to have IQs estimated only from children: almost two third of samples only include individuals under 18 years... This is problematic not only because these samples will be unrepresentative of the national population but also because psychometric test scores are affected by age“. Warne (2022, footnote 14) suspects that Sear has not understood that IQ scores are normed within age cohorts. He may well be correct. Nevertheless, age may be a problem. According to Life History Theory, populations differ in the pace of maturation and the level eventually reached (Rushton, 2000, 2020). On quite different variables, Rushton revealed systematic differences between Blacks, Whites, and East Asians. Blacks mature rapidly, but development stagnates early. Whites mature more slowly, but development lasts longer and reaches a higher final level. In East Asians, the slow-high pattern is even slightly more pronounced. Differential life-history strategies can be seen at all levels, not just between major racial groups, and they can have both genetic and environmental causes. When nations differ in their life-history strategies, looking at children can lead to false expectations about the level eventually achieved.52 Ironically, the effect runs exactly counter to Sear’s political ideology, and on Life History Theory she would probably just scream „Racism! Racism!“.
In typical cherry-picking fashion, Sear lists some cases in Becker’s database where the empirical data are indeed weak, and some are definitively not representative of national IQ. That the available data are unsatisfactory in some respects is a fact that Lynn, Becker and other researchers on national IQs have repeatedly pointed out. However, the less than perfect state of affairs does not justify Sear’s conclusions „The nature of the biases in this particular dataset mean its use may lead to racist conclusions and legitimise eugenic arguments, even where that is not the intention of the authors. No future research should use this dataset, and published papers which have used the dataset should be corrected or retracted.”
Empirical data are not to be judged by what conclusions anyone might draw from them.53 It doesn’t matter at all what Sear deems „racist“ or whether she approves of „eugenic arguments”. Sear is not the Supreme Censor of Science. She has no authority over what is allowed to be published, and demanding that published work be retracted is nothing other than a call for the burning of books.
At this point, it has to be emphasized one more time that the estimates of psychometric intelligence research and student assessment studies are in excellent agreement. Would she like to throw the latter on the pyre as well?
Putting Ideologically Based Criticism into Perspective
It is true that the database for the countries in the middle and lower intelligence ranges is sparse and that there are gaps in the lower range in particular. However, one should lean back and look at the state of affairs in other areas. For all the other psychological traits, the situation looks worse. For some traits, there may be no data at all for developing regions, and even for countries in the middle or even upper intelligence range, the database is meager. For many variables, cross-cultural research is non-existent or so sparse that data are not even available for a few dozen nations.
In addition, for most variables, both reliability and validity are much lower than for intelligence. Consider, for example, the World Happiness Report. Life Satisfaction or Happiness or Well-Being is measured by the Life Ladder, as described above, and this is nothing more than the answer to a single question measured by an 11-point rating scale. The Corruption measure is the average of the two yes/no (= 1/0) questions „Is corruption widespread throughout the government or not?“ and „Is corruption widespread within businesses or not?“54 Positive Affect is the average of the three questions „Did you smile or laugh a lot yesterday?“, „Did you experience the following feelings during A LOT OF THE DAY yesterday? How about Enjoyment?“, „Did you learn or do something interesting yesterday?“ An entire research tradition is based on such weak instruments. Moreover, data are only available for 108 nations. Examples of this kind could be listed endlessly. Even for sophisticated measurement instruments with a long research tradition, the situation does not look much better. For example, Meisenberg (2015) gives the Big Five the following report card: „This article summarizes cross-country research with measures of the Big Five personality dimensions. The conclusion is that these measures have limited reliability and validity when used at the level of country averages“ (p. 360) and he ends his article with the words „extreme caution has to be exercised when using the existing compilations of country-level personality traits” (p. 377).
To avoid misunderstandings: This is not a criticism of the areas mentioned, but just a reminder of the current state of affairs beyond intelligence research.
The overly harsh criticism of psychometric intelligence research is completely out of place and merely testimony to ideologically based double standards. The critics impose requirements that they would never do in other areas. Otherwise, they would have to demand that almost all psychological research, or even almost all social science research, be scrapped.
Conclusion
The phenotypic intelligence of nations can be measured very reliably by both psychometric intelligence tests and international student assessment tests and our national IQs have extraordinarily high validity. It is no exaggeration to state
Intelligence is by far the most important human trait. No one will be able to dig up a variable that is independent of intelligence and has greater explanatory power than that.
Moreover, accounting for non-linearity in the Threshold Model of formal-operative Intelligence has shown that intelligence is much more important than many believe.
The Future of Intelligence – A Look into the Crystal Ball
Finally, we go beyond the scope of this article and take a look into the future of intelligence. We know the current state very well and we also know a lot about the past. About the future, we can only speculate, but it is, after all, a central task of the sciences to make predictions.
For example, the question of the future development of intelligence has been explored by Dutton and Charleton (2015), Dutton and Woodley of Menie (2018), Francis (2022), Lynn (2011a), Meisenberg (2007, 2008), Meisenberg and Lynn (2023), Nyborg (2013), Rindermann (2018), Rindermann and Becker (2023), Rindermann, Becker, and Coyle (2017), Weiss (2000, 2012, 2020). Most expect a stagnation or even a negative Flynn effect for the intelligent countries55 and they assume that the intelligence gains in the other regions will be much lower than the Flynn effect in the 20th century. In particular, they expect only weak gains in sub-Saharan Africa.
Here, we would like to add just one aspect that, oddly enough, is rarely addressed, although it is of paramount importance for the development of humanity in the 21st century. To this end, in Figure 12 we look at the relationship between intelligence and the Total Fertility Rate, i.e. the average number of children a woman can expect to have over the course of her lifetime. The solid line shows the regression line according to the Threshold Model of formal-operative Intelligence. The dotted line shows the number of offspring that would be required to sustain the population in advanced nations.
Figure 12. Intelligence and total fertility rate.
The Total Fertility Rate provides another textbook example of a threshold variable, but this is noted here only in passing.56 The all-important point is: virtually all countries from the upper and top intelligence range are below the minimum that is required for maintaining the stock. Of the 53 nations with an IQ of at least 90, only Israel and Mongolia are above this threshold; the others are mostly far below it. If the trend continues – and everything points to this –, the populations of these nations will shrink dramatically.57 On the other hand, the populations of countries with very low intelligence will explode.
To illustrate what lies ahead for humanity by the end of the 21st century, we divide the countries into three groups: a) the Intelligent (East Asia and Europe with its Western offshoots), b) Sub-Saharan Africa, and c) the Rest. Figure 13 illustrates the population trends according to the United Nations World Population Prospects 2019. Here, we consider the Zero Migration variant. This is based on the completely illusory assumption that no further migration takes place, but it has the advantage that in this perspective the inevitable distortion caused by migration is eliminated.58
Figure 13. UN World population prospects zero-migration.
The number of sub-Saharan Africans will skyrocket from 1.18 billion today (2023) to 3.82 billion in 2100. This will increase their share of the world population from 14.7 to 35.2 percent in 2100. Over the same period, the number of people from the intelligent countries will drop from 2.84 billion to 2.14 billion, and their share of the world’s population will plummet from 35.3 to 19.7 percent. The rest of the world will grow from 4.01 to 4.90 billion, but its share will drop from 49.9 to 45.1 percent.
The addition of 2.64 billion sub-Saharan Africans and the loss of 700 million from the intelligent nations will flip the ratios upside down. Today, there are 2.4 people from the Intelligent group for every sub-Saharan African. By 2100, however, there will be only 0.56. That means the ratio will worsen by a factor of 4.3. Compared to the Rest group, the ratio of the Intelligent will worsen by a factor of 0.62.
All these figures refer to population development. What this implies for human development in the 21st century depends decisively on the development of intelligence. If national IQs were frozen at today’s level, the world IQ would plummet from 86.7 to 81.0, and that would be an unimaginable catastrophe. To maintain the current world IQ despite the dramatic population decline in the intelligent countries, the others will have to make a great leap forward. But merely maintaining the world IQ would be an insufficient goal. It is not the mediocrity that matters, of crucial importance is the upper range of formal-operative thinking. A world that grows by 2 billion while the absolute number of very intelligent people stagnates or even declines does not have rosy prospects.
But intelligence is not carved in stone, and so the fate of humanity depends crucially on the Flynn Effect of the 21st century. As we have mentioned, most intelligence researchers are anything but optimistic in this regard. If their expectations were to materialize, the extremely unfavorable Total Fertility Rate could lead to serious consequences in many areas of life.
Gerhard Meisenberg has sketched the predicament as follows: „From a biological perspective, intelligence is a form of social pathology that leads to the extinction of affected populations. Ideally, we should be intelligent enough to survive but too stupid to control our fertility. This is the state towards which the evolution of human intelligence is heading” (Meisenberg, 2008, p. 240).
We started this article with quotes from antiquity, and we leave the last word to the Greek historian Polybius (c. 200 BC to c. 120 BC). In his book The Histories, which essentially deals with the rise of the Roman Empire, he also mentions an essential reason for the decline of the Greek Civilization.
„In our own time the whole of Greece has been subject to a low birth rate and a general decrease of the population, owing to which cities have become deserted and the land has ceased to yield fruit, although there have neither been continuous wars nor epidemics... For as men had fallen into such a state of pretentiousness, avarice, and indolence that they did not wish to marry, or if they married to rear the children born to them, or at most as a rule but one or two of them, so as to leave these in affluence and bring them up to waste their substance, the evil rapidly and insensibly grew.”
Conclusion
All three research traditions – psychometric intelligence research, large-scale international student assessment studies and Piagetian developmental psychology – must be considered together. The intelligence level of nations has grown historically and the average intelligence of a country’s inhabitants has a profound influence on most areas of life. In many important areas of life, there can be no variable that is independent of intelligence and has greater explanatory power than that.
_____
The final version of this work will be entitled “The Intelligence of Nations. Historical Roots and Current Correlates”. The extensive chapter on the historical development of intelligence is still in progress. The current preliminary version constitutes a stand-alone paper.
All data were taken from freely accessible databases.
Footnotes
1 Quotations from German sources have been translated by me, R.H. This applies in particular also to originally English-language texts which I have available in German version; these have been back-translated and probably only rarely agree with the original. All emphases as in the original. Where books are cited, the year of the edition available to me is given.
3 New data have been added, but „the inclusion criteria for this study has been stricter than that of its predecessors and the number of sources is, therefore, lower than is found in the works by Lynn and Vanhanen” (Lynn and Becker, 2019, p. 12).
4 International student assessment studies were already conducted in the 1960s (Lee and Barro, 1997), but the large-scale systematic research programs are more recent. TIMSS started in 1995, PISA, arguably the most important of these, was launched in 2000, and PIRLS in 2001.
5 The brief characterization of the stages follows the description by Oesterdiekhoff and Rindermann (2008). „All major theories described four levels of intellectual development with transitions at 1½- 2, 6-7, and 11-12 years … associated with increasingly abstract representations and some kind of recycling within levels … Obviously, there must be something powerful in these transitions to have been recognized by every theorist” (Demetriou, Spanoudis and Shayer, 2015).
6 Luria, 1976, pp. 108-109; as cited by Flynn, 2009, p. 25.
7 Based on Oesterdiekhoff and Rindermann, (2008, pp. 7-8); slightly modified.
8 Since Richard Lynn had already drawn attention to the phenomenon before James Flynn and has himself amassed an enormous mountain of data that provided the empirical foundation for the discussion, some researchers refer to it as the Lynn-Flynn effect or the FLynn effect. However, these terms have not been adopted, nor has the common practice of naming a phenomenon after its actual discoverer. Edward A. Rundquist (1936) is considered to be the discoverer. However, he refers to the unpublished master thesis of Fred P. Roesell (1935; a summary was published under the same title in 1937). Roesell compared performance on the Miller Mental Ability Test for three Minnesota cities in 1920 and 1934 and found an increase in intelligence for all grades from 7th to 12th. Overall, IQ increased from 118 to 122; and this represents an increase of 0.29 points per year. For the history of the discovery of the Flynn effect, see Lynn (2013).
9 Pietschnig and Voracek (2015), Trahan, Stuebing, Hiscock and Fletcher (2014), Wongupparaj et al. (2023).
10 Bratsberg and Rogeberg, (2018), Colom et al. (2023), Dutton and Lynn (2015), Dutton, van der Linden and Lynn (2016), Dutton and Woodley of Menie (2018), Gonthier, Grégoire and Besançon, M. (2021). Shayer and Ginsburg (2009), Shayer, Ginsburg and Coe (2007), Woodley and Dunkel (2015), Woodley and Meisenberg (2013).
11 Wongupparaj et al. (2023) report much smaller increases in Raven’s.
12 The results refer to the period 1950 to 2004; Flynn, 2012, pp. 21-23.
13 What is meant, of course, is not post-scientific, whatever that may be, but scientific.
14 On differential descendants of social classes see Clark (2007, 2014, 2023), Clark and Hamilton (2006), Weiss (1993, 2000). On the Northwestern European Marriage Pattern see for example Carmichael, de Pleijt and van Zanden (2016), Hajnal (1965, 1982), Henrich (2020), Oesterdiekhoff (2002, 2024), Szołtysek, Poniat, Klüsener and Gruber (2019), Todd (2018), Van Zanden, de Moor and Carmichael (2019). On the differential utilization of contraceptive methods in Europe, China, and the Islamic world see Meisenberg (2007, 2014).
15 A special form of genetic sieving was the execution of criminals. In the 11th century, the state and the Catholic Church reached a consensus that „the wicked should be punished so that the good may live in peace. Courts imposed the death penalty more and more often and, by the late Middle Ages, were condemning to death between 0.5 and 1.0% of all men of each generation, with perhaps just as many offenders dying at the scene of the crime or in prison while awaiting trial. Meanwhile, the homicide rate plummeted from the 14th century to the 20th“ (Frost and Harpending, 2015, p. 230). Since crime is associated with low intelligence (Ellis and Walsh, 2003; Wilson and Herrnstein, 1985), the gene pool has been shifted in this way toward higher intelligence.
16 The terms eugenic and dysgenic refer exclusively to effects that lead to higher or lower intelligence, respectively. They do not contain any value judgment.
17 Cattell (1950; 1983), Egeland (2022), Woodley of Menie, Fernandes, Figueredo and Meisenberg (2015).
18 For a more detailed analysis of the relationship between intelligence and corruption, see Henss (2021).
19 On the debunking of the nonsensical radical environmental determinist position, cf. Warne (2021), Fuerst, Shibaev and Kirkegaard (2023).
20 We consider the years 2022 and 2023. More recent data is available for some indices. As the values generally change only extremely little – for consecutive years the correlations are usually above .95, often .99 – this has no importance at all.
21 Lim et al. (2018) also provided a comprehensive analysis based on student assessment studies and some psychometric intelligence tests for 195 nations. However, they completely ignore the invaluable trove of evidence from the Lynn and Vanhanen tradition. Therefore, their learning measure is essentially based on student assessment studies. The product-moment correlation with the national IQs that we derive below is .86 (N = 192). The same applies to Altinok and Diebolt (2023). For a compilation of the various data sets, see the database of Emil Kierkegaard (2023).
22 In Becker’s database, our R corresponds to R, our LV12 corresponds to the index L&V12+GEO; our NIQB corresponds to QNW+SAS+GEO. GEO indicates that for a few countries for which no data are available, national IQ has been estimated on the basis of neighboring countries. This is common practice and the error is likely to be quite small.
23 I would like to thank Przemysław Lewandowski for his valuable help in formulating the model and writing an Excel program. The program can be downloaded at https://thresholdmodel.wordpress.com/2021/05/25/downloads/ (Lewandowski and Henss, 2019).
24 The near-perfect correlation is no surprise, as Rindermann’s R is essentially an update and extension of Lynn and Vanhanen’s estimates.
25 Alternatively, one can determine the first unrotated factor through principal component analysis. The values obtained correlate with our measure at .99, so it does not matter which one is used. We prefer the median because it is easy for anyone to calculate.
26 To some extent, the differences are due to different sample sizes.
27 For Bangladesh, Guyana, Iraq, Niger, Solomon Islands, Tonga, and Vanuatu, intelligence research yields notably higher estimates; only for Gabon are the student assessment studies estimates notably higher.
28 The results of PISA 2022 have also been published in the meantime (OECD, 2023). As a result of the Covid-19 pandemic, many countries have suffered a slump, which distorts the picture. As China also did not participate, we use the data from PISA 2018.
29 On intelligence differenes between Chinese provinces, see Jensen (2023a,b), Kirkegaard (2015), Lynn and Cheng (2013), Patrinos and Angrist (2018, Annex 4). Lim et al. (2018) give a value of 100 for China and Altinok and Diebolt (2023) a staggering 89. Both contain a mixture with non-IQ data; see the Kirkegaard (2023) database.
30 Kirkegaard considers, on the one hand, the Social Progress Index, which deliberately does not include economic variables, and, on the other hand, the Democracy Ranking, which includes some economic variables. He calls the S-factor from the joint dataset general socioeconomic factor. We refer to the S-factor based on the Social Progress Index only.
31 The data are available as rankings and have been reversed.
32 „For several countries, particularly developing countries, statistics related to budget balance as a percentage of GDP are subject to frequent revisions by such data sources as the IMF“ (Kim, 2023, p. 407).
33 „Generosity is the residual of regressing the national average of GWP [Gallup World Poll; R.H.] responses to the donation question „Have you donated money to a charity in the past month?” on log GDP per capita“ (Helliwell et al. 2023a, p. 39).
34 The variable L&V02+GEO in Becker’s NIQ dataset contains estimates for only 183 countries.
35 For another view on the long breath of history, see Comin, Easterly and Gong (2009), Lynn (2012), Olsson and Paik (2020).
36 For seminal discoveries in genetic research, see Manco (2018), Plomin (2018), Reich (2018).
37 „The area of culture emergence extends ... as a narrow strip from the Atlantic to the Pacific, from Europe over North Africa, Near East, to India and China ... in its length about one fourth, in its width less than one twelfth of the earth’s circumference … This axis of the world history seems to lie around 500 before Christ, in the spiritual processes that took place between 800 and 200. There lies the deepest breakthrough of history. There arose the human being, with whom we live up to today. For the sake of brevity, this period shall be called the »Achsenzeit«” (Jaspers, 1960, p. 43; pp. 19-20).
38 The median of the four groups is 104.6, 97.3, 82.9, and 70.0, respectively.
39 On the greater importance of origin over present geographic location, see Ertan, Fiszbein and Putterman (2016), Lynn (2012), Putterman and Weil (2010).
40 The Jews, especially the Ashkenazim, have developed their extraordinarily high intelligence over centuries in Europe. The Jews who remained in the Middle East and the Arab population of Israel are far less intelligent. For the extraordinary Jewish intelligence, see Frost, 2022; Lynn, 2011b; MacDonald, 2002; Murray, 2007.
41 Literature for this section: On slavery, see Darlington (1971, 1980), Davis (2003, 2009), Flaig (2018), Frost (2020), Gilley (2020), N’Diaye (2010), Sowell (1994). On colonialism, Black (2019), Chua (2007), Edels (2023a,b), Ferguson (2004), Gilley (2018a,b, 2022a,b, 2023), Sharman (2019). On White Man’s Tomb, see Curtin (1989). On trends in per capita income of sub-Saharan Africa and the rest of the world, see Maddison (2006, 2007). Gilley (2023) includes a comprehensive bibliography on Western colonization, tellingly titled „Contributions of Western colonialism to human flourishing: A research bibliography.” On the decline of violence, see Pinker (2011).
42 „For people of pre-modern cultures, slavery is not only God-given, but the most natural thing in the world ... Neither the philosophers nor the slaves themselves find slavery reprehensible in principle“ (Oesterdiekhoff, 2013, p. 397).
43 „Whether we try to look at the number of offspring or the genetic influence, it can be said that Islamic slavery, through castration, infanticide, and perversion, almost wiped out the offspring of African slaves in Arab countries“ (Darlington, 1971, p. 731).
44 „About 600,000 slaves were transported to the United States … About 310,000 of these persons were imported into the Thirteen Colonies before 1776 … They constituted less than 5% of the 12 million enslaved people brought from Africa to the Americas“ (Wikipedia https://en.wikipedia.org/wiki/Slavery_in_the_United_States, 2023/06/30).
45 Davis (2003, 2009), Flaig (2018), Frost (2020).
46 „Within weeks or months after colonial rule ended, African societies unraveled into primordial structures, and the state collapsed along with civic life. The examples are too numerous and tragic to recount” (Gilley, 2018b, p. 9).
47 „Gross National Income (GNI) is the total amount of money earned by a nation’s people and businesses. It ... includes the nation’s gross domestic product (GDP) plus the income it receives from overseas sources“ (https://www.investopedia.com/terms/g/gross-national-income-gni.asp; accessed 2023/06/12). As a rule, the two measures are very similar, but in exceptional cases, they can diverge sharply.
48 Population size in thousands: Liechtenstein 39, Brunei 445, Luxembourg 639, Qatar 2,688, United Arab Emirates 9,365, Saudi Arabia 35,950, China 1,425,893 (United Nations, 2022b; World Population Prospects 2022, estimates as of 1 July 2021).
49 Elsewhere, Warne (2023a) comments on the fundamental flaw in Ebbesen’s reasoning thus: „Ironically, the logic of interpreting low average IQ scores as meaning that the majority of a country’s citizens have an intellectual disability is exactly the simplistic interpretation of IQ scores that no intelligence expert would ever make. Anyone making this inference from low average national IQ scores is only demonstrating their own ignorance about intellectual disability and the interpretation of IQ scores“.
50 On the distinction between developmental height and developmental breadth and the capabilities of primitive peoples and pre-modern societies, see for example Hallpike (1990, 2008, 2011, 2018), Oesterdiekhoff (2012, 2013).
51 For a comprehensive, informed, and balanced discussion of the strengths and weaknesses of Becker’s NIQ database, we refer to Warne (2022, 223a, 223b).
52 Bakhiet, Dutton et al. (2018), Bakhiet, Lynn und Meisenberg (2015); Becker et al. (2023), Figueredo, Hertler and Penaherrera‑Aguirre (2020), Hu (2022, 2023), Ziada et al. (2017).
53 For a drastic demolition of this fallacious way of thinking, see Edels (2023c).
54 Transparency International’s Corruption Perception Index, which we looked at in Figure 1, is based on 13 different indices and measures the extent of perceived corruption on a scale of 0 to 100.
55 However, some respondents in Rindermann, Becker, and Coyle’s survey expect intelligence gains for China.
56 For statistical parameters, see Table 16.
57 For example, Meisenberg calculates, „At a fertility rate of 1.3, as now prevails in Germany, the number of people of reproductive age will drop to 3.5% of the original population within 200 years (in seven generations) ... 2.8 million people of the original 80 would then remain in Germany in 2208“ (Meisenberg, 2008, p. 239). Currently, the TFR is 1.4, but that is due to mass immigration of people from countries with much lower intelligence, which have higher birth rates.
58 In the Western world, the situation is actually even more unfavorable because the large number of immigrants already present from less intelligent countries have a higher birth rate than the autochthonous population.
References
Altinok, N. & Diebolt, C. (2023). Cliometrics of learning-adjusted years of schooling: evidence from a new dataset. Cliometrica. https://doi.org/10.1007/s11698-023-00276-x
Altinok, N., Diebolt, C. & Demeulemeester, J.-L. (2014). A new international database on education quality: 1965-2010. Applied Economics, 46, 1212-1247.
American Psychiatric Association (1998). Diagnostic and Statistical Manual of Mental Disorders: DSM-IV (4th ed.). American Psychiatric Association, Washington, DC: American Psychiatric Publishing.
American Psychiatric Association (2013). Diagnostic and Statistical Manual of Mental Disorders: DSM-5 (5th ed.). American Psychiatric Association, Washington, DC: American Psychiatric Publishing.
Bakhiet, S. F. A., Dutton, E., Ashaer, K., Essa, Y., Blahmar, T., Hakami, S. & Madison, G. (2018). Understanding the Simber Effect: Why is the age-dependent increase in children’s cognitive ability smaller in Arab countries than in Britain? Personality and Individual Differences, 122, 38-42.
Bakhiet, S. F. A., Lynn, R. & Meisenberg, G. (2015). Non-Verbal Ability of Zulu Children across 56 years. Mankind Quarterly, 55, 340-351
Bal-Sezerel, B., Ateşgöz, N. N., & Kirişçi, N. (2023). Intelligence differences across years: A trend analysis. Kuramsal Eğitimbilim Dergisi [Journal of Theoretical Educational Science], 16, 107-126.
Barnett, S. M. & Williams, W. (2004). National intelligence and the emperor’s new clothes. Contemporary Psychology, 49, 389-396.
Becker, D. (2019). The NIQ-dataset (V1.3.2). Chemnitz, Germany. https://viewoniq.org/
Becker, D., Meisenberg, G., Dutton, E., Bakhiet, S. F. A., Alfayez, F. A. & Essa, Y. A. S. (2023). International differences in the speed of cognitive development: A systematic examination of the existence of the Simber Effect. Acta Psychologica, 240, 104015.
Bell, J. A. & Nuzzo, J. B. (2021). Global Health Security Index: Advancing collective action and accountability amid global crisis, 2021. Available: https://ghsindex.org/
Black, J. (2019). Imperial legacies. The British Empire around the world. New York: Encounter Books.
Bold, T., Filmer, D., Martin, G., Molina, E., Rockmore, C., Stacy, B., Svensson, J. & Wane, W. (2017a). What do teachers know and do? Does it matter?Evidence from primary schools in Africa. World Bank Group. Education Global Practice Group. Development Research Group. Africa Region. Policy Research Working Paper 7956.
Bold, T., Filmer, D., Martin, G., Molina, E., Stacy, B., Rockmore, C., Svensson, J. & Wane, W. (2017b). Enrollment without learning: Teacher effort, knowledge, and skill in primary schools in Africa. Journal of Economic Perspectives, 31, 185-204. https://doi.org/10.1257/jep.31.4.185
Bratsberg, B. & Rogeberg, O. (2018). Flynn effect and its reversal are both environmentally caused. PNAS, 115 (26) 6674-6678 https://doi.org/10.1073/pnas.1718793115
Brown, M., Wai, J. & Chabris, C. (2020). Can you ever be too smart for your own good? Linear and nonlinear effects of cognitive ability. Perspectives on Psychological Science, 16 (6), 1337-1359. https://doi.org/10.1177/1745691620964122
Carmichael, S. G., de Pleijt, A. & van Zanden, J. L. (2016). The European Marriage Pattern and its measurement. The Journal of Economic History, 76, 196-204.
Cattell, R.B. (1950). The fate of national intelligence: Test of a thirteen-year prediction. Eugenics Review, 62, 136-148.
Cattell, R.B. (1983). Intelligence and national achievement. Washington, DC: The Institute for the Study of Man.
Chua, A. (2007). Day of empire. How hyperpowers rise to global dominance – and why they fall. New York: Anchor Books.
Clark, C. J., Winegard, B. M., Beardslee, J., Baumeister, R. F. & Shariff, A. F. (2020). Declines in religiosity predict increases in violent crime – but not among countries with relatively high average IQ. Psychological Science, 3(2):170-183.
Clark, G. (2007). A farewell to alms. A brief economic history of the world. Princeton: Princeton University Press.
Clark, G. (2014). The son also rises. Princeton, NJ: Princeton University Press.
Clark, G. & Hamilton, G. (2006). Survival of the richest: The Malthusian mechanism in pre-industrial England. The Journal of Economic History, 66, 1-30.
Cohen, F. (2010). Die zweite Erschaffung der Welt. Wie die moderne Naturwissenschaft entstand. Frankfurt/Main: Campus Verlag. English edition: Cohen, F. (2011). How modern science came into the world: Four civilizations, one 17th-century breakthrough. Amsterdam: Amsterdam University Press.
Cohen, J. (1988). Statistical power analysis for behavioral sciences. San Diego: Academic Press.
Colom, R, García, L. F., Shih, P. C. & Abad, F. J. (2023). Generational intelligence tests score changes in Spain: Are we asking the right question? Intelligence, 99 (2023) 101772.
Comin, D., Easterly, W. & Gong, E. (2010). Was the wealth of nations determined in 1000 BC? American Economic Journal: Macroeconomics, 2, 65-97.
Coyle, T. R., Rindermann, H., Hancock, D. & Freeman, J. (2018). Non-linear effects of cognitive ability on economic productivity. Journal of Individual Differences, 39, 39-47.
Curtin, P. D. (1989). Death by migration: Europe’s encounter with the tropical world. Cambridge: Cambridge University Press.
Darlington, C. D. (1971). Die Entwicklung des Menschen und der Gesellschaft. Eine Kulturgeschichte. Düsseldorf: Econ Verlag. [English edition: Darlington, C. D. (1969). The evolution of Man and society. London: George Allen and Unwin Ltd.]
Darlington, C. D. (1980). Die Wiederentdeckung der Ungleichheit. Frankfurt/Main: Umschau Verlag. [English edition: Darlington, C. D. (1978). The little universe of Man. London: George Allen and Unwin Ltd.]
Davis, R. C. (2003). Christian slaves, muslim masters: White slavery in the Mediterranean, The Barbary Coast, and Italy, 1500-1800. New York: Palgrave Macmillan.
Davis, R. C. (2009). Holy war and human bondage: Tales of christian-muslim slavery in the early-modern Mediterranean. Santa Barbara: Praeger, ABC-CLIO.
Deary, I. J., Strand, S., Smith, P. & Fernandes, C. (2006). Intelligence and educational achievement. Intelligence, 35, 13-21.
Dutton, E. & Charlton, B. G. (2015). The genius famine. Why we need geniuses. Why they’re dying out. Why we must rescue them. Buckingham: The University of Buckingham Press.
Dutton, E., van der Linden, D. & Lynn, R. (2016). The negative Flynn effect: A systematic literature review. Intelligence, 59, 163-169.
Dutton, E., & Lynn, R. (2015). A negative Flynn Effect in France, 1999 to 2008–9. Intelligence, 51, 67-70.
Dutton, E. & Woodley of Menie, M. (2018). At our wit’s end. Why we’re becoming less intelligent and what it means for the future. Exeter: Imprint Academic.
Ebbesen, C. L. (2020, June 17). Flawed estimates of cognitive ability in Clark et al. Psychological Science, 2020. PsyArXiv, 17 June 2020. https://doi.org/10.31234/osf.io/tzr8c
Economist Intelligence Unit (2023). Democracy Index 2022. Frontline democracy and the battle for Ukraine. London: The Economist Intelligence Unit Limited.
Egeland, J. (2022). The ups and downs of intelligence: The co-occurrence model and its associated research program. Intelligence, 92 (2022) 101643.
Ellis, L. & Walsh, A. (2003). Crime, delinquency and intelligence. In Nyborg, H. (Ed.). The scientific study of general intelligence. Amsterdam: Elsevier.
Ertan, A, Fiszbein, M. & Putterman, L. (2016). Who was colonized and when? Across-country analysis of determinants. European Economic Review, 83, 165-184.
Ferguson, N. (2004). Empire. How Britain made the modern world. Penguin Random House UK.
Ferguson, N. (2013). Der Westen und der Rest der Welt. Berlin: Ullstein. [Ferguson, N. (2011). The West and the Rest. London: Allen Lane.]
Flaig, E. (2018). Weltgeschichte der Sklaverei. München: C. H. Beck.
Flynn, J. R. (1984). The mean IQ of Americans: Massive gains 1932 to 1978. Psychological Bulletin, 95, 29-51.
Flynn, J. R. (1987). Massive IQ gains in 14 nations: What IQ tests really measure. Psychological Bulletin, 101, 171-191.
Flynn, J. R. (2009). What is intelligence? Beyond the Flynn Effect. Cambridge: Cambridge University Press.
Flynn, J. R. (2012). Are we getting smarter? Rising IQ in the twenty-first-century. Cambridge: Cambridge University Press.
Figueredo, A. J., Hertler, S. C. & Peñaherrera-Aguirre, M. (2021). The biogeography of human diversity in cognitive ability. Evolutionary Psychological Science, 7, 106-123. https://doi.org/10.1007/s40806-020-00267-5
Francis, G. (2022). Dysgenics by the numbers. Quantifying the fall of civilization.
Frost, P. & Harpending, H. C. (2015). Western Europe, state formation, and genetic pacification. Evolutionary Psychology www.epjournal.net 13 (1), 230-243.
Galton, F. (1869). Hereditary genius. An inquiry into its laws and consequences. London: Macmillan. (Reproduction at Forgotten Books, www.forgottenbooks.org).
Galton, F. (1883). Inquiry into human faculty and its development. London: Macmillan. (Reproduction at Elibron Classics. www.elibron.com).
Gilley, B. (2022a). In defense of German Colonialism: And how its critics empowered Nazis, Communists, and the enemies of the West. Washington, DC: Regnery Gateway.
Gonthier, C., Grégoire, J. & Besançon, M. (2021). No negative Flynn effect in France: Why variations of intelligence should not be assessed using tests based on cultural knowledge. Intelligence, 84, January - February 2021, 101512.
Grinin, L. & Korotayev, A. (2015). Great Divergence and Great Convergence. A global perspective. Cham: Springer International Publishing Switzerland.
Gust, S., Hanushek, E. A. & Woessmann, L. (2022). Global universal basic skills: Current deficits and implications for world development. Working Paper 30566. Massachusetts, MA: National Bureau of Economic Research. http://www.nber.org/papers/w30566
Hajnal, J. (1965). European marriage patterns in perspective. In Glass, D. V. & Eversley, D. E. C. (Eds.). Population in history. Essays in historical demography. 101-143.
Hajnal, J. (1982). Two kinds of preindustrial household formation system. Population and Development Review, 8, 449-494.
Hallpike, C. R. (1990/1979). Die Grundlagen primitiven Denkens. München: dtv. [English edition: Foundations of primitive thought. Oxford: Clarendon Press, 1978]
Hallpike, C. R. (2008). How we got here. From bows and arrows to the space age. Central Milton Keynes: Author House.
Hallpike, C. R. (2011). On primitive society and other forbidden topics. Bloomington, IN: Author House.
Hallpike, C. R. (2018). Ship of fools. An anthology of learned nonsense about primitive society. Kouvola, Finland: Castalia House.
Hanushek, E. A. & Woessman, L. (2015). The knowledge capital of nations: Education and the economics of growth. Cambridge, Mass.: MIT Press.
Haque, M. E. & Kneller, R. (2005). Corruption and development: A test for non-linearities. University of Nottingham Research Paper 2005/25.
Harmacek, J., Krylova, P. & Htitich, M. (2022). 2022 Social Progress Index Data. Washington, DC: Social Progress Imperative. Available at www.socialprogress.org
Helliwell, J. F., Layard, R., Sachs, J. D., Aknin, L. B., De Neve, J.-E. & Wang, S. (Eds.). (2023a). World Happiness Report 2023 (11th ed.). Sustainable Development Solutions Network.
Helliwell, J. F., Huang, H., Norton, M., Wang, S. & Goff, L. (2023b). Statistical Appendix for „World happiness, trust and social connections in times of crisis,” Chapter 2 of World Happiness Report 2023.
Henrich, J. (2020). The WEIRDest people in the world. How the West became psychologically peculiar and particularly prosperous. New York: Farrar, Straus and Giroux.
Hunt, E. (2011). Human intelligence. Cambridge: Cambridge University Press.
Hunt, E. & Sternberg, R. J. (2006). Sorry, wrong numbers: An analysis of a study of a correlation between skin color and IQ. Intelligence, 34, 131-137.
INSEAD (2022). The Global Talent Competitiveness Index 2022: The tectonics of talent: Is the world drifting towards increased talent inequalities? Fontainebleau, France.
Institute for Economics & Peace (2022a). Positive Peace Report 2022:Analysing the factors that build, predict and sustain peace. Sydney, January 2022. http://visionofhumanity.org/resources (accessed 20/05/2023).
Institute for Economics & Peace (2022b). Global Peace Index 2022: Measuring peace in a complex world. Sydney, June 2022. http://visionofhumanity.org/resources (accessed 20/05/2023).
Jaspers, K. (1960). Vom Ursprung und Ziel der Geschichte. München: Piper. [Jaspers, K. (1953). The origin and goal of history. New Haven, CT: Yale University Press.]
Jencks, C. (1972). Inequality: A reassessment of the effects of family and schooling in America. New York: Basic Books.
Jensen, A. R. (1998) The g Factor: The science of mental ability. Westport, CT: Praeger.
Kim, A. B. (2023). 2023 Index of Economic Freedom. Washington, DC: The Heritage Foundation.
Kirkegaard, E. O. W. (2014). The international general socioeconomic factor: Factor analyzing international rankings. Open Differential Psychology, 8th of September. https://openpsych.net/paper/28/
Kirkegaard, E.O. (2015). The S factor in China. The Winnower.
Lim, S. S., Updike, R. L., Kaldjian, A. S., Barber, R. M., Cowling, K., York, H., Friedman, J., Xu, R., Whisnant, J. L., Taylor, H. J., Leever, A. T., Roman, Y., Bryant, M. F., Dieleman, J., Gakidou, E. & Murray, C. J. L. (2018). Measuring human capital: a systematic analysis of 195 countries and territories, 1990–2016. The Lancet, 392 (10154), 1217-1234. https://doi.org/10.1016/S0140-6736(18)31941-X
Luria, A. R. (1976). Cognitive development: Its cultural and social foundations. Cambridge, MA: Harvard University Press.
Lv, Z. (2017). Intelligence and corruption: An empirical investigation in a non-linear framework. Journal of Behavioral and Experimental Economics, 69, 83-91.
Lynn, R. (1991). Race differences in intelligence: A global perspective. The Mankind Quarterly, 31, 255-297.
Lynn, R. (2011a). Dysgenics. Genetic deterioration in modern populations. London: Ulster Institute for Social Research.
Lynn, R. (2011b). The chosen people: A study in Jewish intelligence and achievement. Washington Summit Publishers.
Lynn, R. (2012). IQs predict differences in the technological development of nations from 1000 BC through 2000 AD. Intelligence, 40, 439-444.
Lynn, R. (2013). Who discovered the Flynn effect? A review of early studies of the secular increase of intelligence. Intelligence, 41, 765-769.
Lynn, R. (2015). Race differences in intelligence. An evolutionary analysis. Second revised edition. Arlington, VA: Washington Summit Publishers.
Lynn R. (2018). The intelligence of nations. In Sternberg, R. J. (Ed.). The nature of human intelligence. Cambridge: Cambridge University Press, 256-269.
Lynn, R. (2020). Memoirs of a dissident psychologist. London: Ulster Institute for Social Research.
Lynn, R. & Becker, D. (2019). The intelligence of nations. London: Ulster Institute for Social Research.
Lynn, R. & Cheng, H. (2013). Differences in intelligence across thirty-one regions of China and their economic and demographic correlates. Intelligence, 41, 553-559.
Lynn, R. & Meisenberg, G. (2010). The average IQ of sub-Saharan Africans: Comments on Wicherts, Dolan, and van der Maas. Intelligence, 38, 21-29.
Lynn, R., Meisenberg, G., Mikk. J. & Williams, A. (2007). National IQs predict differences in scholastic achievement in 67 countries. Journal of Biosocial Science, 39, 861-874.
Lynn, R. & Mikk, J. (2007). National differences in intelligence and educational attainment. Intelligence, 35, 115-121.
Lynn, R. & Vanhanen, T. (2002). IQ and the wealth of nations. Westport, Connecticut: Praeger.
Lynn, R. & Vanhanen, T. (2006). IQ and global inequality. Augusta, Georgia: Washington Summit Publishers.
Lynn, R. & Vanhanen, T. (2012). Intelligence. A unifying construct for the social sciences. London: Ulster Institute for Social Research.
MacDonald, K. B. (2002). A people that shall dwell alone. Judaism as a group evolution strategy, with diaspora peoples. Lincoln, NE: Writers Club Press.
Mackintosh, N. J. (1998). IQ and human intelligence. Oxford: Oxford University Press.
Maddison, A. (2006). The world economy. Volume 1: A millennial perspective. Volume 2: Historical statistics. Paris: OECD. Development Center Studies.
Maddison, A. (2007). Contours of the world economy, 1-2030 AD. Essays in macro-economic history. Oxford: Oxford University Press.
Manco, J. (2018). Ancestral journeys. The peopling of Europe from the first ventures to the Vikings. London: Thames & Hudson.
Meisenberg, G. (2007). In God’s image. The natural history of intelligence and ethics. Brighton: Book Guild.
Meisenberg, G. (2008). Intelligenz- und Wertentwicklung in Gesellschaften an der Schwelle zur Moderne. In Oesterdiekhoff, G. W. & Rindermann, H. (Eds.). Kultur und Kognition. Die Beiträge von Psychometrie und Piaget-Psychologie zum Verständnis kultureller Unterschiede. Münster: LIT Verlag, 209-242.
Meisenberg, G. (2014). What are the causes of cognitive evolution? A critique and extension of psychogenetic theory. The Mankind Quarterly, 54, 326-338.
Meisenberg, G. (2015). Do we have valid country-level measures of personality? Mankind Quarterly, 55, 360-382.
Meisenberg, G. & Lynn, R. (2011). Intelligence: A study of human capital in nations. The Journal of Social, Political and Economic Studies, 36, 421-454.
Meisenberg, G. & Lynn, R. (2023). Ongoing trends of human intelligence. Intelligence, 96 (2023) 101708.
Murray, C. (2004). Human accomplishment. The pursuit of excellence in the arts and sciences, 800 B.C. to 1950. New York: Perennial.
N’Diaye, T. (2010). Der verschleierte Völkermord: Die Geschichte des muslimischen Sklavenhandels in Afrika. Hamburg: Rowohlt.
Nyborg, H. (2013). The decay of Western civilization. Double relaxed Darwinian selection. In Nyborg, H. (Eds.). Race and sex difference in intelligence and personality. A tribute to Richard Lynn at 80. London: Ulster Institute for Social Research, 187-211.
OECD (2018). PISA for Development. Assessment and analytical framework: Reading, Mathematics and Science. Paris: OECD Publishing. http://dx.doi.org/10.1787/9789264305274-en
OECD (2019a). PISA 2018 Results (Volume I): What students know and can do. Paris: PISA, OECD Publishing. https://doi.org/10.1787/5f07c754-en
OECD (2019b). PISA 2018 Results (Volume II): Where all students can succeed. Paris: PISA, OECD Publishing. https://doi.org/10.1787/b5fd1b8f-en
OECD (2023). PISA 2022 Results (Volume II): Learning during – and from – disruption. Paris: PISA, OECD Publishing. https://doi.org/10.1787/a97db61c-en
Oesterdiekhoff, G. W. (2002). Familie, Wirtschaft und Gesellschaft in Europa. Die historische Entwicklung von Familie und Ehe im Kulturvergleich. Sieferle, R. P. & Breuninger, H. (Eds.). Der Europäische Sonderweg. Ein Projekt der Breuninger Stiftung. Band 6. Stuttgart: Breuninger Stiftung.
Oesterdiekhoff, G. W. (2012). Was pre-modern man a child? The quintessence of the psychometric and developmental approaches. Intelligence, 40, 470-478. https://doi.org/10.1016/j.intell.2012.05.005
Oesterdiekhoff, G. W. (2013). Die Entwicklung der Menschheit von der Kindheitsphase zur Erwachsenenreife. Wiesbaden: Springer VS.
Oesterdiekhoff, G. W. (2021). World history and societal evolution: Historical periods and psychological stages. Mankind Quarterly, 61. 10.46469/mq.2021.61.4.3
Olsson, O. und Paik, C. (2020). A Western reversal since the Neolithic? The long-run impact of early agriculture. The Journal of Economic History, 8, 80, 100-135.
Piaget, J. (1948). The moral judgment of the child. New York: The Free Press.
Piaget, J. & Garcia, R. (1989). Psychogenesis and the history of science. New York: Columbia University Press.
Pietschnig, J. & Voracek, M. (2015). One century of global IQ gains: A formal meta-analysis of the Flynn Effect (1909-2013). Perspectives on Psychological Science, 10, 282-306.
Pinker, S. (2011). The Better Angels of our nature. Why violence has declined. New York: The Viking Press.
Plomin, R. (2018). Blueprint. How DNA makes us who we are. Cambridge, MA: MIT Press.
Pritchett, L. (2013). The rebirth of education. Schooling ain’t learning. Washington, DC: Center for Global Development.
Putterman, L. & Weil, D. N. (2010). Post-1500 population flows and the long run determinants of economic growth and inequality. The Quarterly Journal of Economics, 125, 1627-1682.
Reich, D. (2018). Who we are and how we got there. Ancient DNA and the new science of the human past. Oxford: Oxford University Press.
Rindermann, H. (2006). Was messen internationale Schulleistungsstudien? Schulleistungen, Schülerfähigkeiten, kognitive Fähigkeiten, Wissen oder allgemeine Intelligenz? Psychologische Rundschau, 57 (2), 69-86. https://doi.org/10.1026/0033-3042.57.2.69
Rindermann, H. (2007). The g-factor of international cognitive ability comparisons: the homogeneity of results in PISA, TIMSS, PIRLS and IQ-tests across nations. European Journal of Personality, 21, 667-706. https://doi.org/10.1002/per.634
Rindermann, H. (2018). Cognitive Capitalism. Human capital and the wellbeing of nations. Cambridge: Cambridge University Press.
Rindermann, H. (2023). The advantages of having a minority viewpoint in politicized psychology: A case study of intelligence research. In Frisby, C. L., Redding, R., O’Donohue, W. T. & Lilienfeld, S. O. (Eds.). Ideological and political bias in psychology: Nature, scope, and solutions. Cham: Springer. 709-741.
Rindermann, H. & Ackermann, L. (2020). Piagetian tasks and psychometric intelligence: different of similar constructs? Psychological Reports, 0(0), 1-27.
Rindermann, H. & Becker, D. (2023). The future of intelligence: A prediction of the FLynn effect based on past student assessment studies until the year 2100. Personality and Individual Differences, 206 (2023), 112110.
Rindermann, H., Becker, D. & Coyle, T. R. (2017). Survey of expert opinion on intelligence: The FLynn effect and the future of intelligence. Personality and Individual Differences, 106, 242-247.
Rindermann, H., Sailer, S. & Thompson, J. (2009). The impact of smart fractions, cognitive ability of politicians and average competence of peoples on social development. Talent Development and Excellence, 1, 3-25.
Roesell, F. P. (1935). A comparative study of the mental level in grades seven through twelve in three Minnesota towns in 1920 and 1934. Unpublished Master’s Thesis, University of Minnesota Library.
Roesell, F. P. (1937). Comparative mental ability of high school pupils in three Minnesota towns in 1920 and 1934. Minnesota Studies in Articulation.
Rojas, (2018). Happiness in Latin America has social foundations. In Helliwell, J. F., Layard, R. Sachs, J. D. (Eds.). World Happiness Report 2018. New York: Sustainable Development Solutions Network. 114-146. https://s3.amazonaws.com/happiness-report/2018/CH6-WHR-lr.pdf
Rushton, J. P. (2000). Race, evolution, and behavior: A life history perspective (3rd ed.). Port Huron, MI: Charles Darwin Research Institute.
Rushton, J. P. (2020). Odyssey. My life as a controversial evolutionary psychologist. Milton Keynes UK: Lightning Source UK Ltd.
Russo, L. (2004). The forgotten revolution: How science was born in 300 BC and why it had to be reborn. Berlin: Springer.
Sear, R. (2022). ‘National IQ’ datasets do not provide accurate, unbiased or comparable measures of cognitive ability worldwide. PsyArXiv. https://doi.org/10.31234/osf.io/26vfb
Sharman, J. C. (2019). Empires of the weak. The real story of the European expansion and the creation of the new world order. Princeton, NJ: Princeton University Press.
Shayer, M., & Ginsburg, D. (2009). Thirty years on – a large anti‐Flynn effect/(II): 13‐and 14‐year‐olds. Piagetian tests of formal operations norms 1976-2006/7. British Journal of Educational Psychology, 79, 409-418.
Shayer, M., Ginsburg, D. & Coe, R. (2007). Thirty years on – a large anti‐Flynn effect? The Piagetian test Volume & Heaviness norms 1975-2003. British Journal of Educational Psychology, 77, 25-41.
Sowell, T. (1994). Race and culture. A world view. New York: Basic Books.
Spearman, C. (1927). The abilities of man. New York: Macmillan.
Szołtysek, M., Poniat, R., Klüsener, S. & Gruber, S. (2019). Family organisation and human capital inequalities in historical Europe: Testing the association anew. In Dieboldt, C. et al. (Eds.). Cliometrics of the family, studies in economic history. Cham: Springer Nature Switzerland, 83-120.
Todd, E. (2018). Traurige Moderne. Eine Geschichte der Menschheit von der Steinzeit bis zum Homo Americanus. München: C.H. Beck.
Trahan, L., Stuebing, K. K., Hiscock, M. K. & Fletcher, J. M. (2014). The Flynn effect: A Meta-analysis. Psychological Bulletin, 140, 1332-1360.
UNDP (2023). Human Development Report 2021/2022. Uncertain times, unsettled lives. Shaping our future in a transforming world. New York: United Nations Development Programme.
Van Zanden, J. L. & de Moor, T. & Carmichael, S. (2019). Capital Women: The European Marriage Pattern, female empowerment and economic development in Western Europe 1300-1800. Oxford: Oxford University Press.
Vonderach, A. (2014). Völkerpsychologie. Was uns unterscheidet. Schnellroda: Verlag Antaios.
Wai, J. & Rindermann, H. (2017). What goes into high educational and occupational achievement? Education, brains, hard work, networks, and other factors. High Ability Studies, https://doi.org/10.1080/13598139.2017.1302874
Warne, R. T. (2021). Between-group mean differences in intelligence in the United States are >0% genetically caused: five converging lines of evidence. American Journal of Psychology, 134, 480-501.
Warne, R. T. (2022). National mean IQ estimates: Validity, data quality, and recommendations. Evolutionary Psychological Science. 19. Dec. 2022. Databank: https://doi.org/10.1007/s40806-022-00351-y
Weede, E. (2004). Does human capital strongly affect economic growth rates? Yes, but only if assessed properly. Comparative Sociology, 3, 115-134.
Weede, E. und Kämpf, S. (2002). The Impact of intelligence and institutional improvements on economic growth. Kyklos, 55, 361-380.
Weiss, V. (1993). Bevölkerung und soziale Mobilität. Sachsen 1550-1880. Berlin: Akademie Verlag.
Weiss, V. (2000). Die IQ-Falle. Intelligenz, Sozialstruktur und Politik. Graz: Leopold Stocker Verlag.
Weiss, V. (2002). Zur Vererbung der Intelligenz zu Sozialstruktur und Familienpolitik als eine Nachbetrachtung zum Bericht PISA 20002. Veröffentlichungen der Gesellschaft für Freie Publizistik, 18, 31-59.
Weiss, V. (2012). Die Intelligenz und ihre Feinde. Aufstieg und Niedergang der Industriegesellschaft. Graz: Ares Verlag.
Weiss, V. (2020). IQ means inequality. The population cycle that drives human history. Amazon Kindle Direct Publishing.
Wilson, J. Q. & Herrnstein, R. J. (1985). Crime and human nature. New York: Simon and Schuster.
Wongupparaj, P., Wongupparaj, R., Morris, R. G. & Kumari, V. (2023). Seventy years, 1000 samples, and 300,000 SPM scores: A new meta-analysis of Flynn effect patterns. Intelligence, 98, 101750.
Woodley, M. A., & Dunkel, C. (2015). In France, are secular IQ losses biologically caused? A comment on Dutton and Lynn. Intelligence, 53, 81-85. http://dx.doi.org/10.1016/j.intell.2015.08.009
Woodley, M., & Meisenberg, G. (2013). In the Netherlands the anti-Flynn effect is a Jensen effect. Personality and Individual Differences, 54, 871–876. https://doi.org/10.1016/j.paid.2012.12.022
Woodley of Menie, M. A., Fernandes, H. B. F., Figueredo, A. J. & Meisenberg, G. (2015). By their words ye shall know them: Evidence of genetic selection against general intelligence and concurrent environmental enrichment in vocabulary usage since the mid 19th century. the mid 19th century. Frontiers in Psychology, 6:361. https://doi.org/10.3389/fpsyg.2015.00361
World Bank (2018). World Development Report 2018:Learning to realize education’s promise. Washington, DC: World Bank.
World Intellectual Property Organization (WIPO) (2022). Global Innovation Index 2022: What is the future of innovation-driven growth? Geneva: WIPO. https://doi.org/10.34667/tind.46596
Ziada, K., Metwaly, H., Bakhiet, S., Cheng, H. & Lynn R. (2017). A new study of intelligence in Egypt. Mankind Quarterly, 58, 307-311.

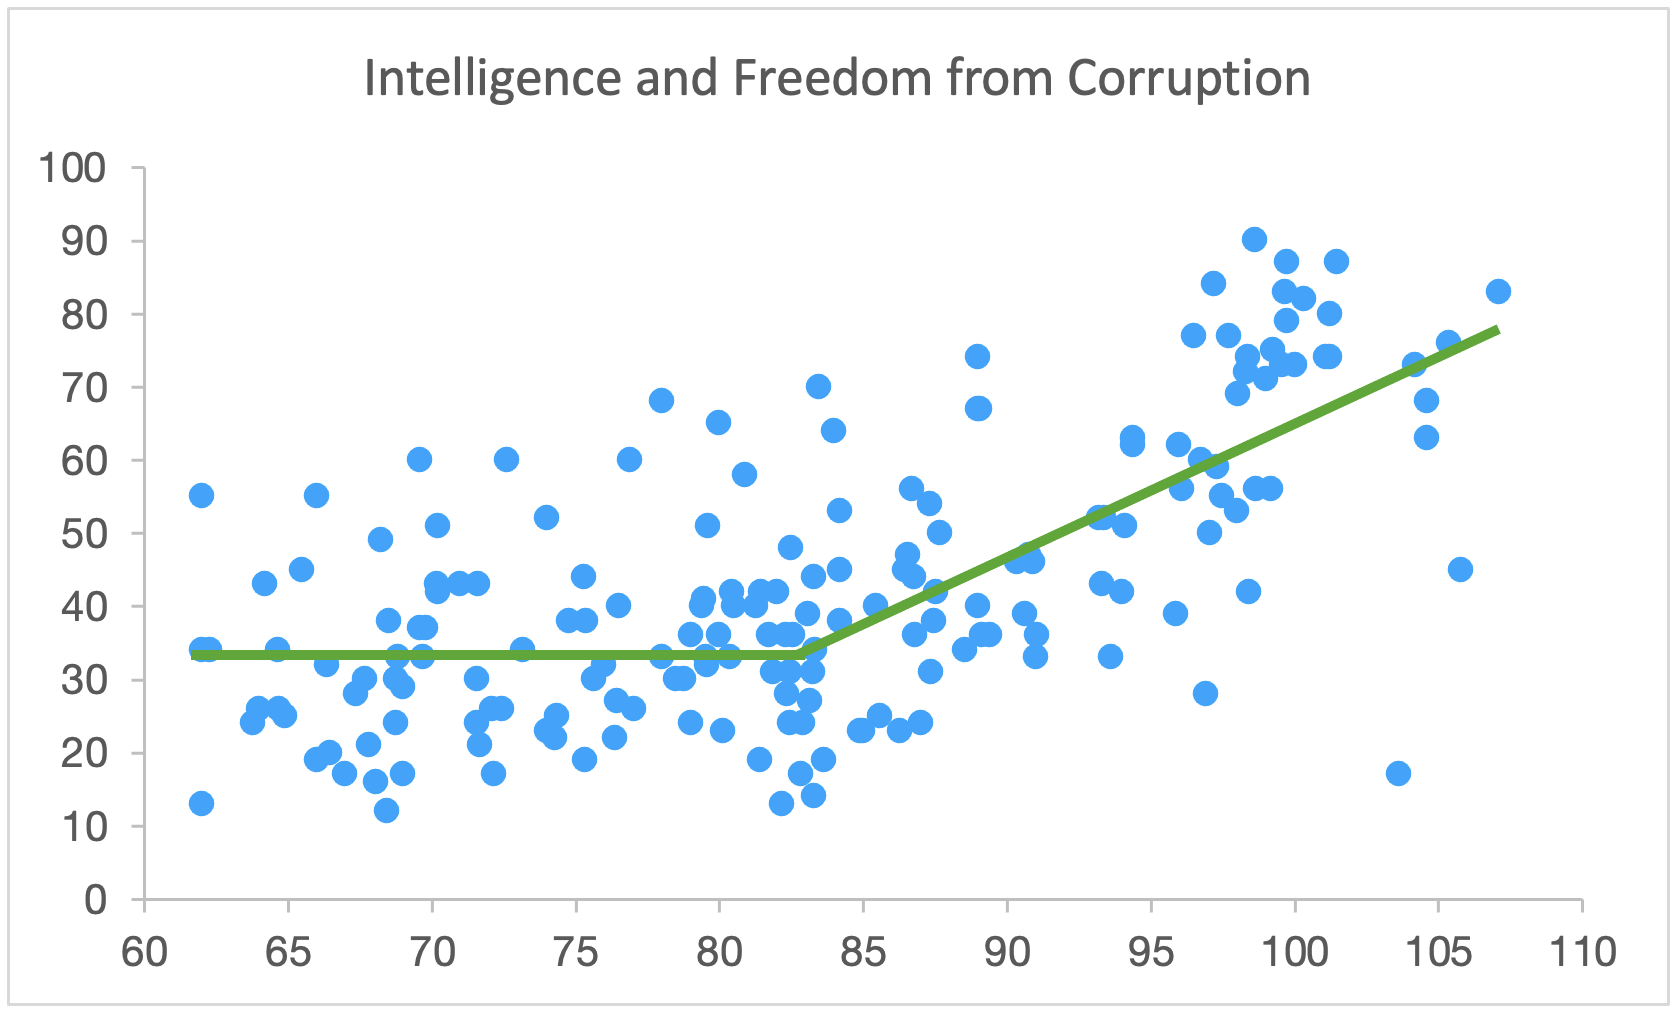
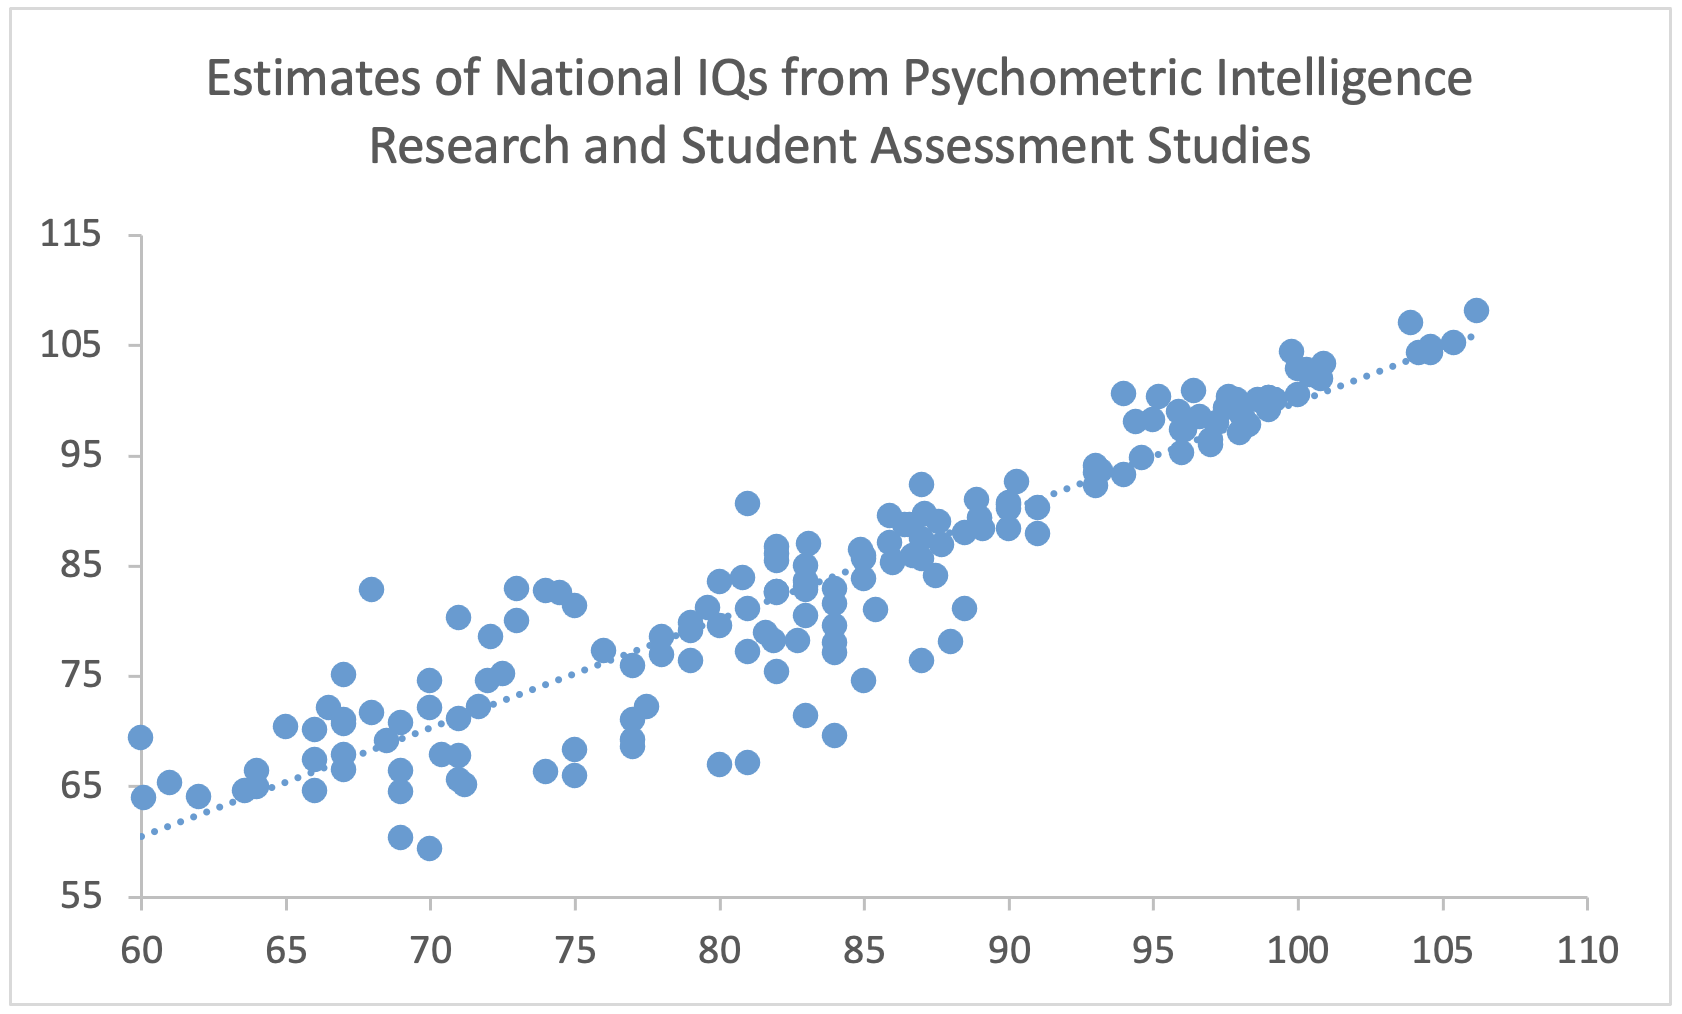
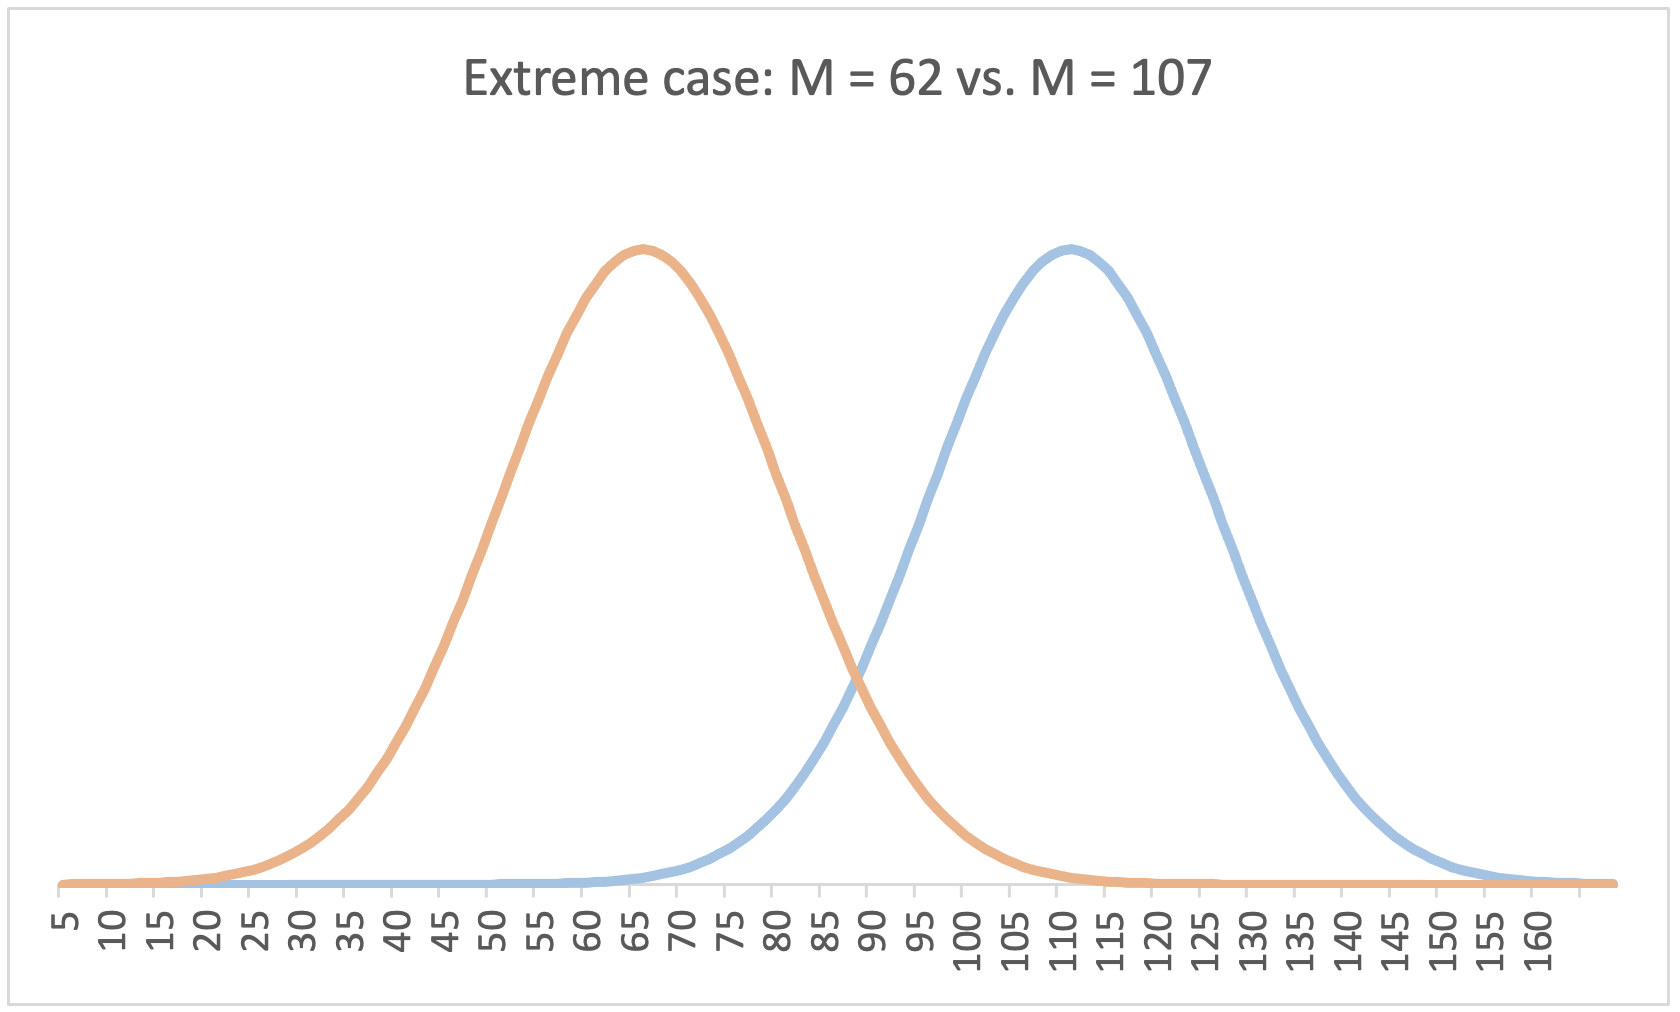
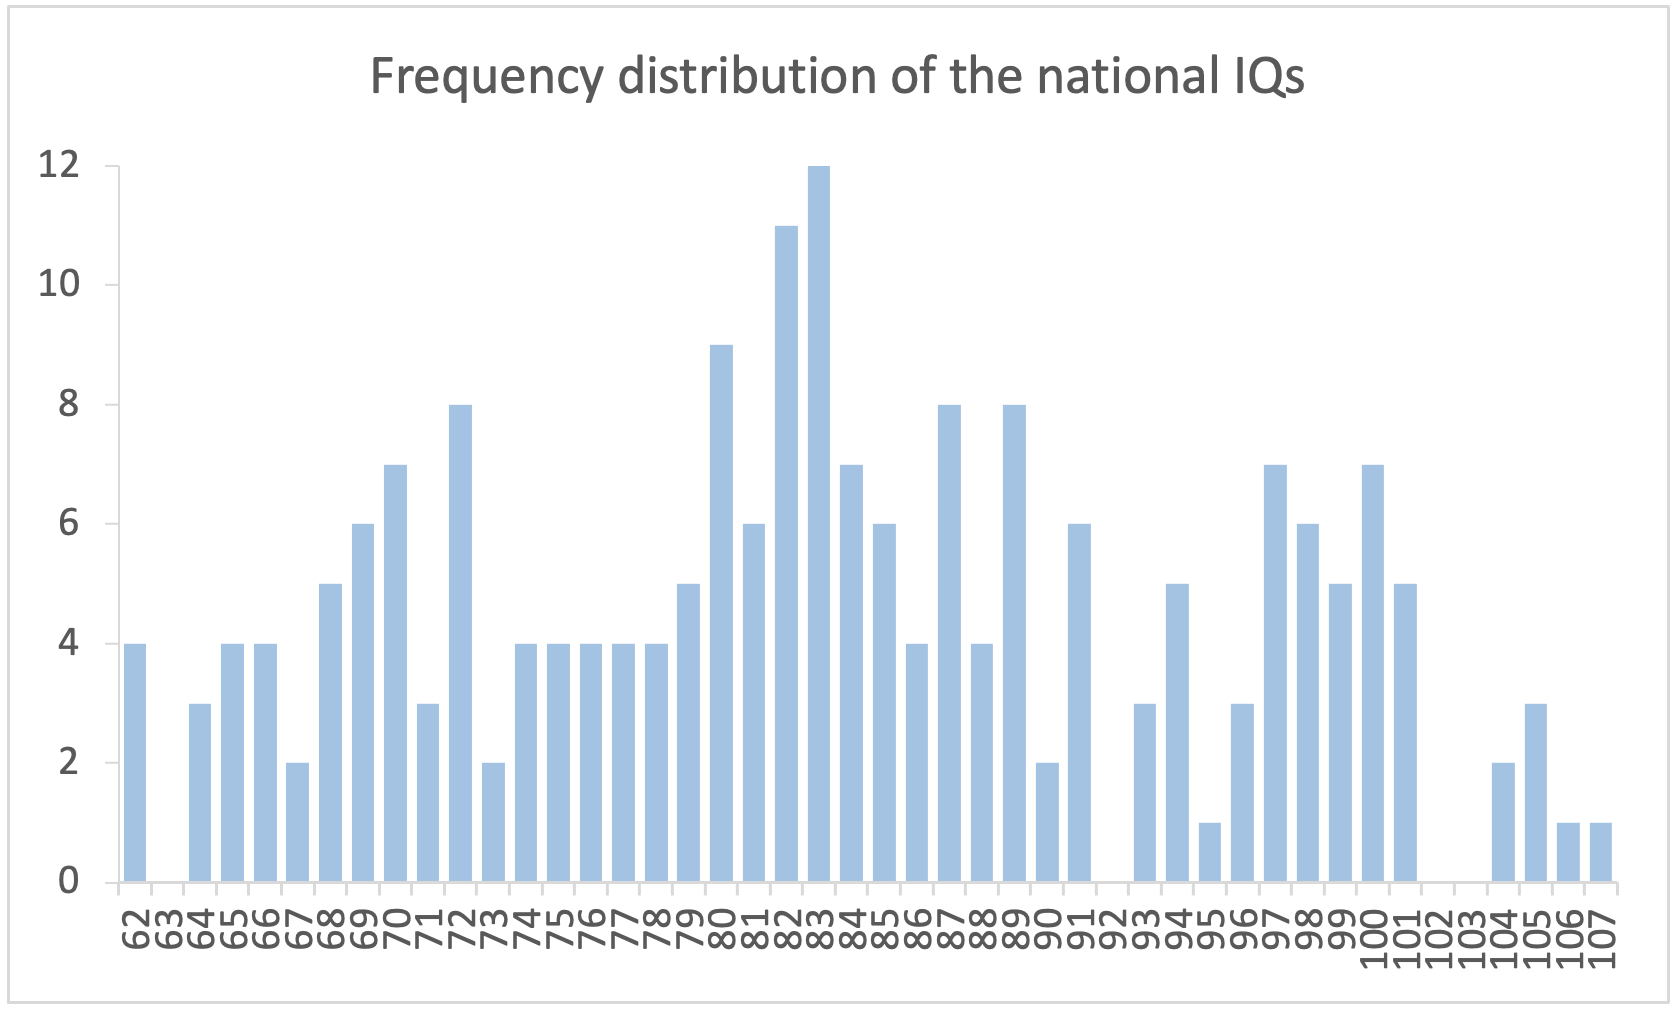
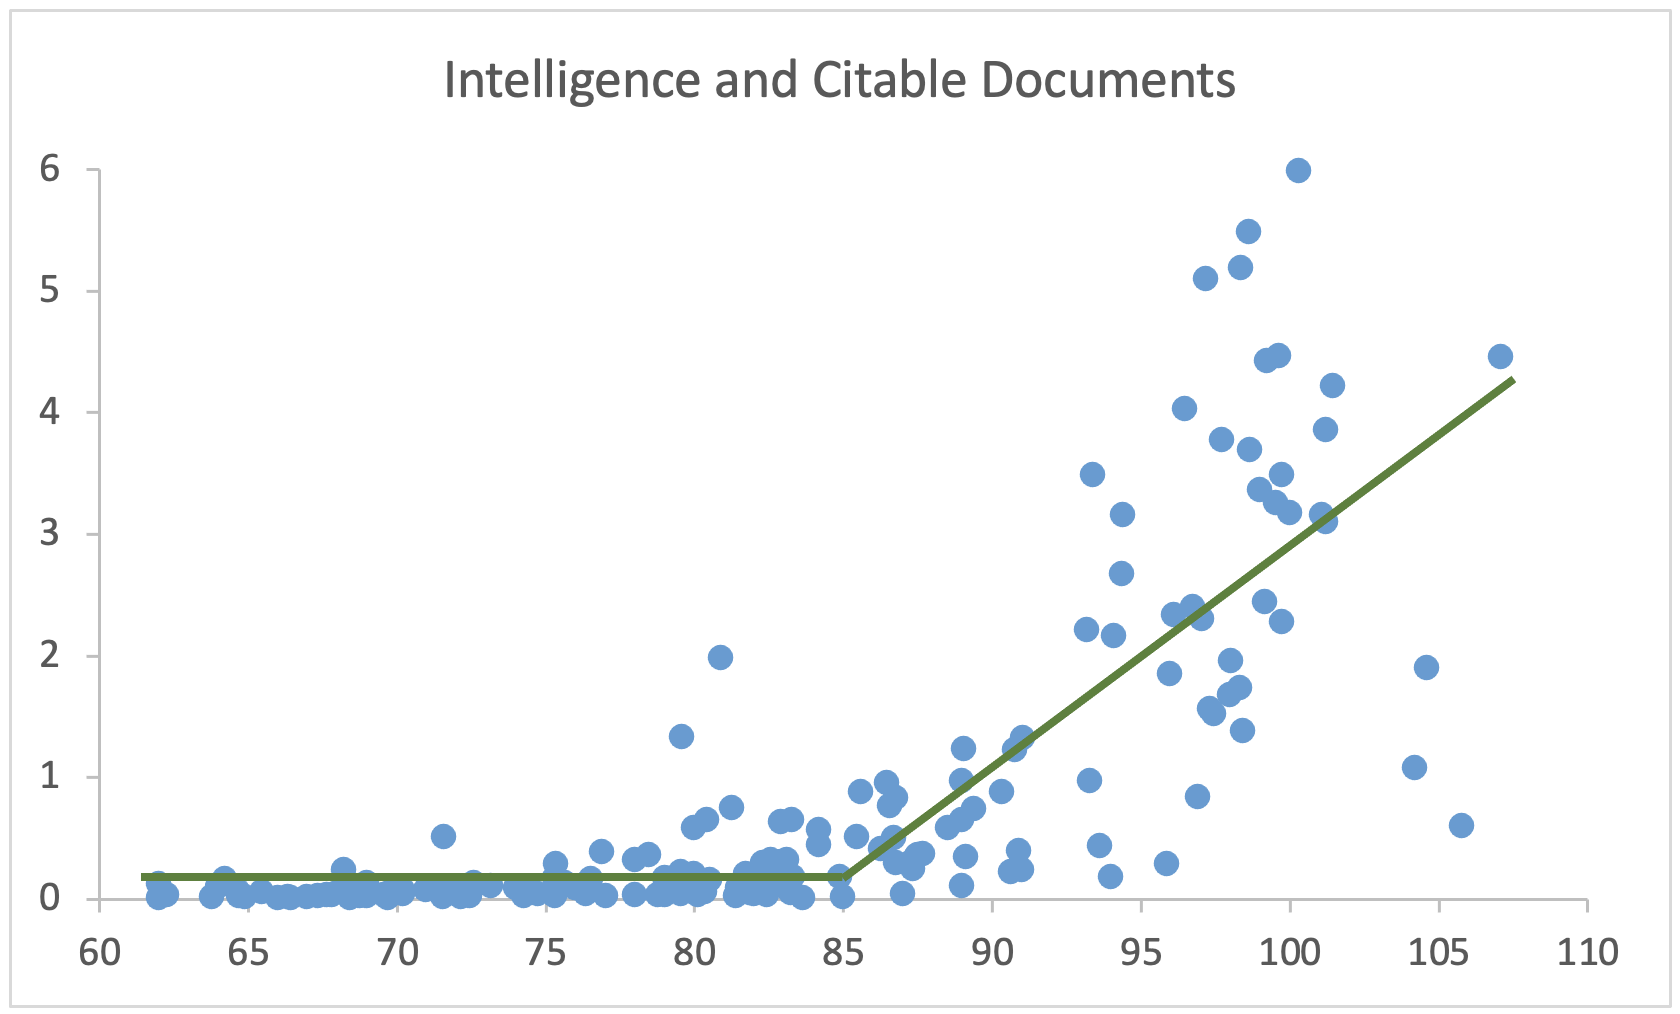
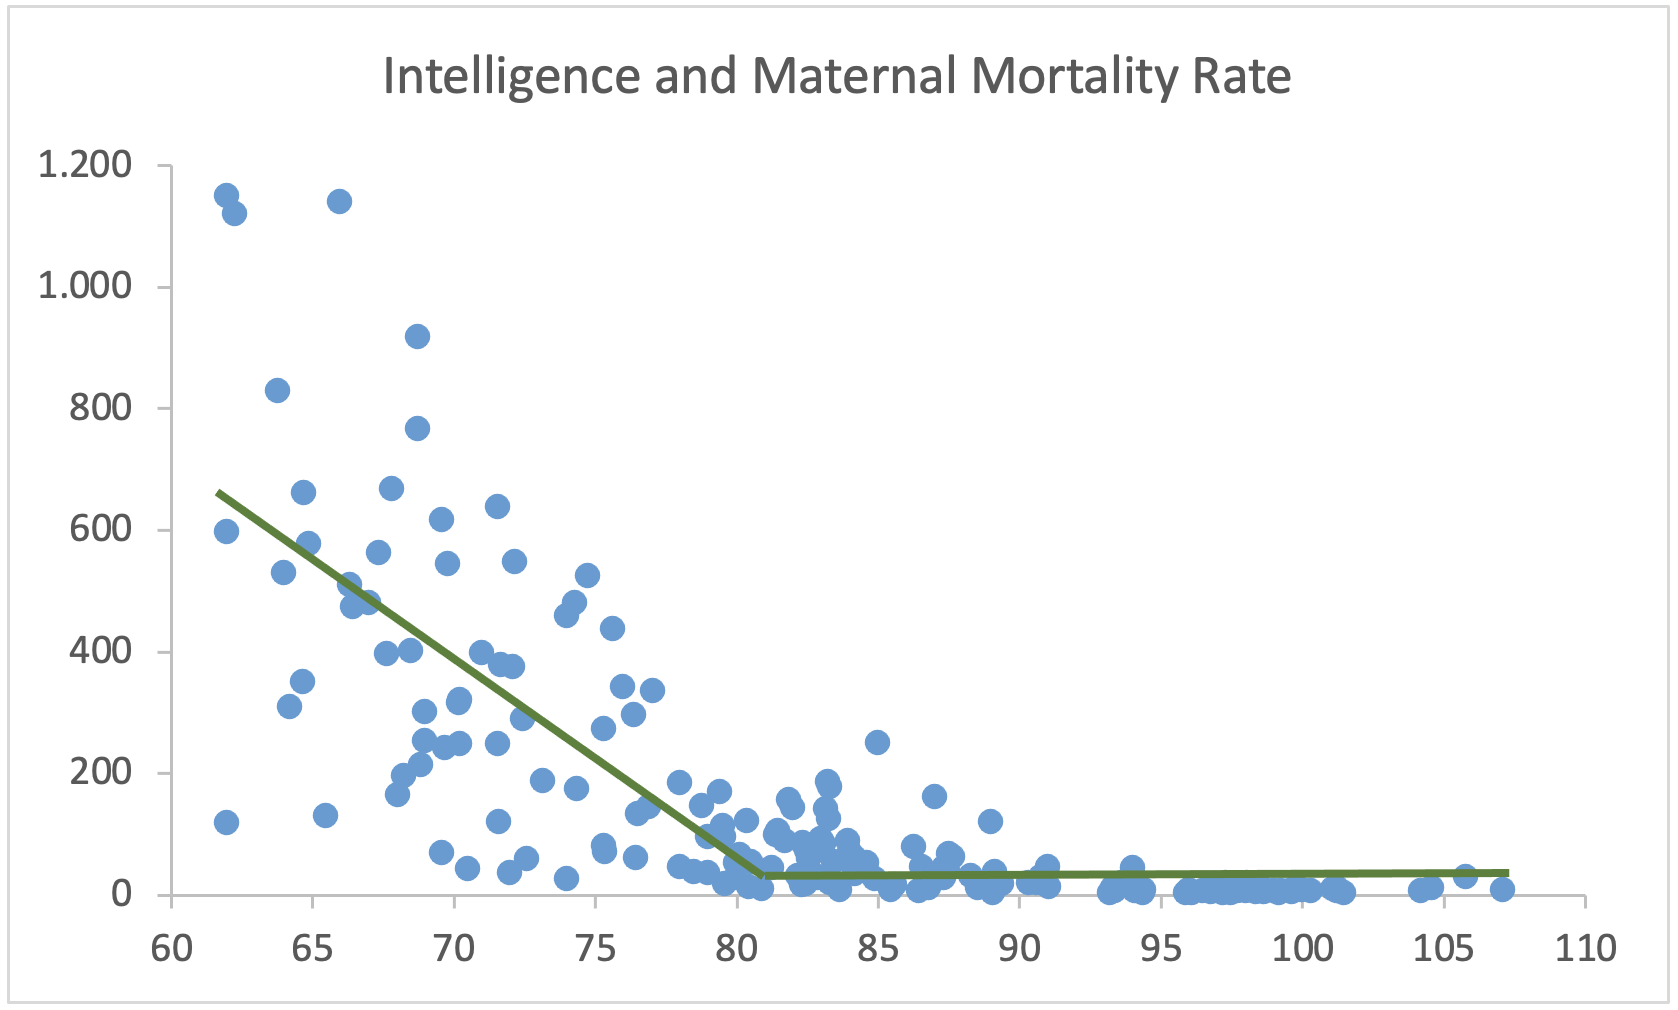
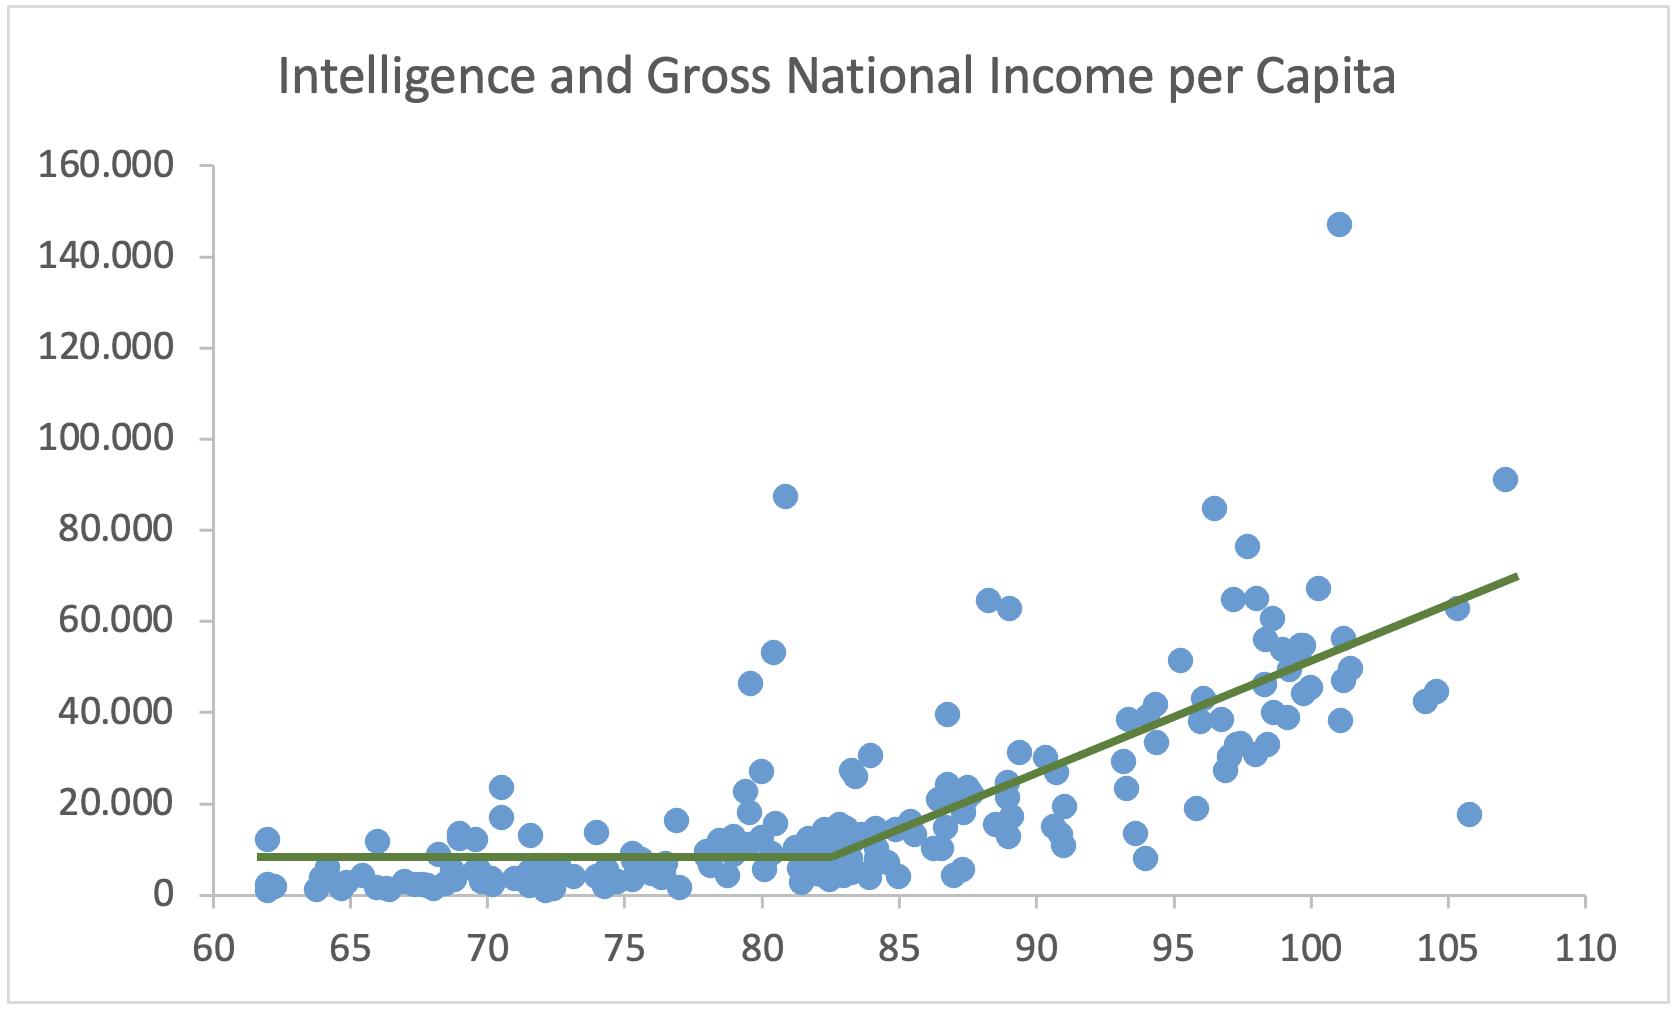
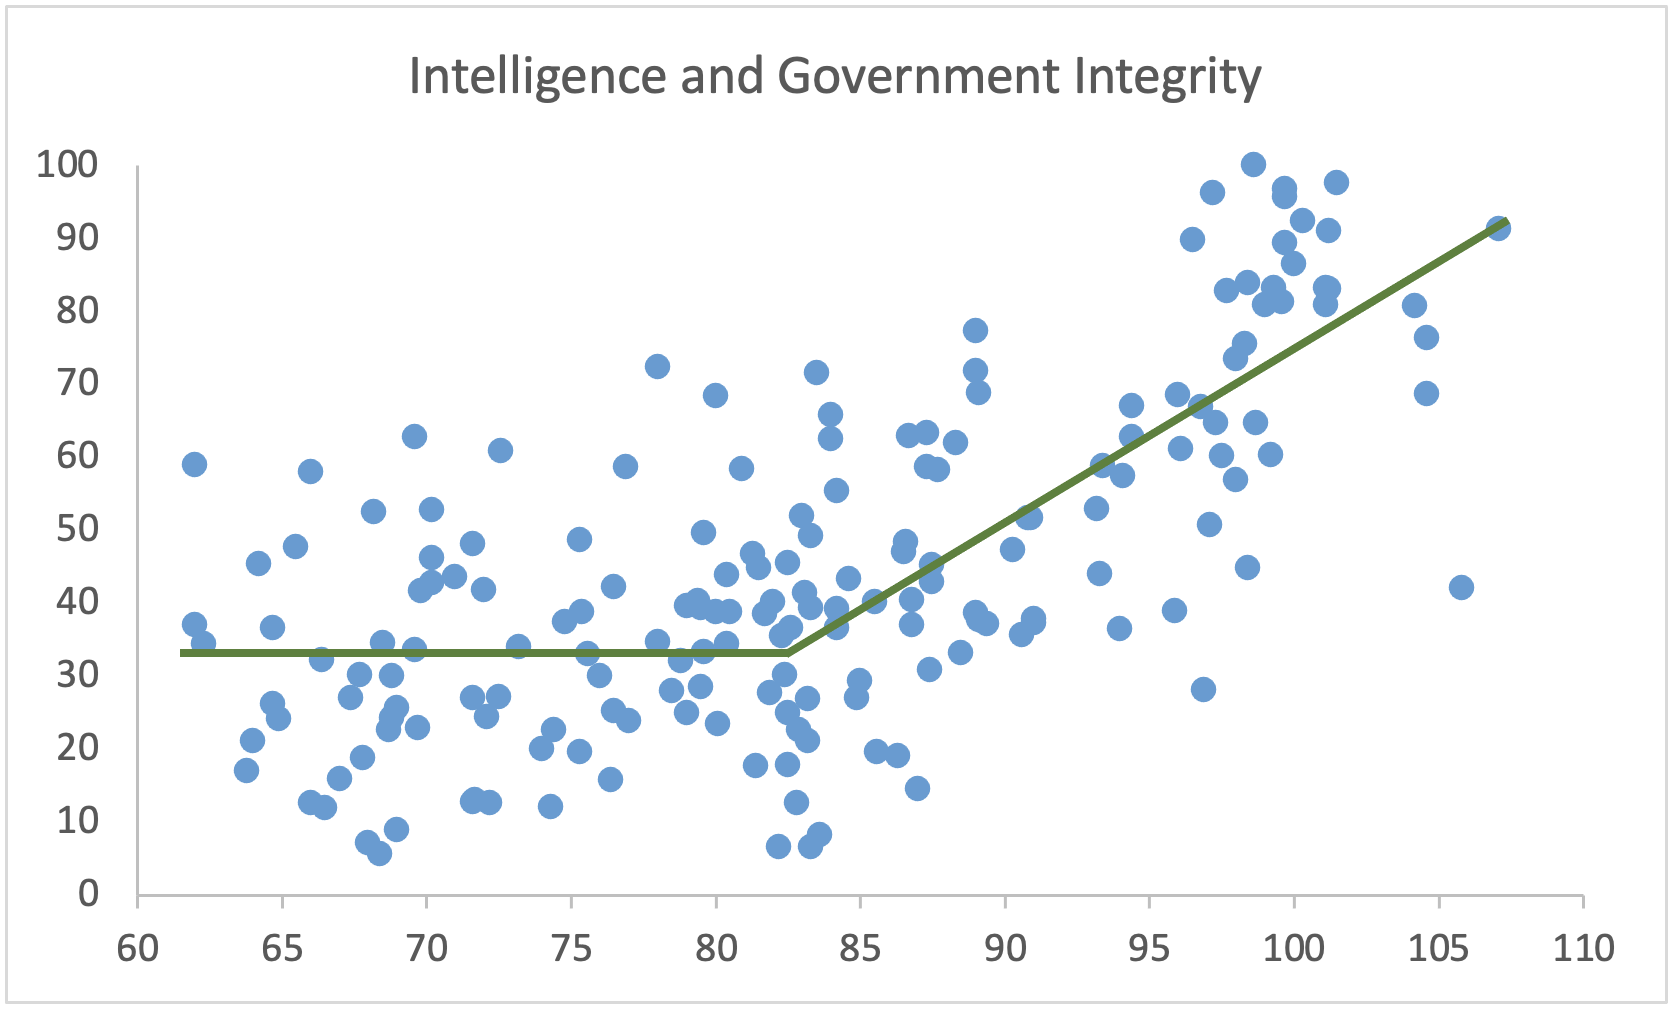
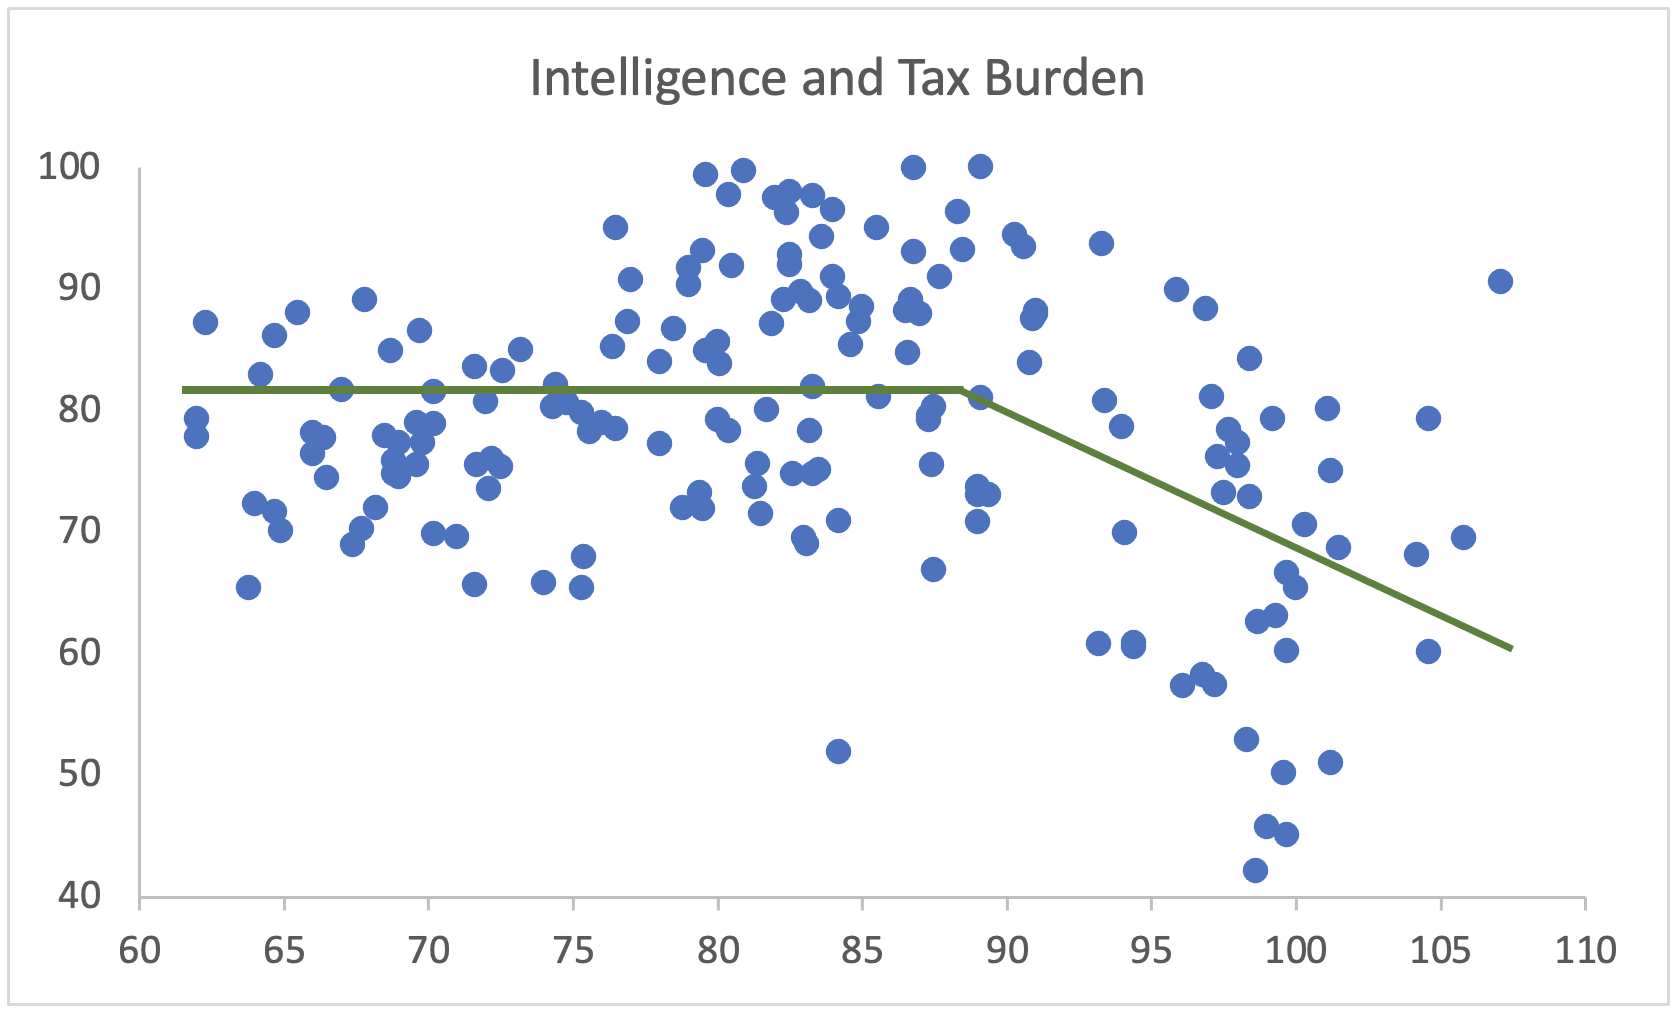
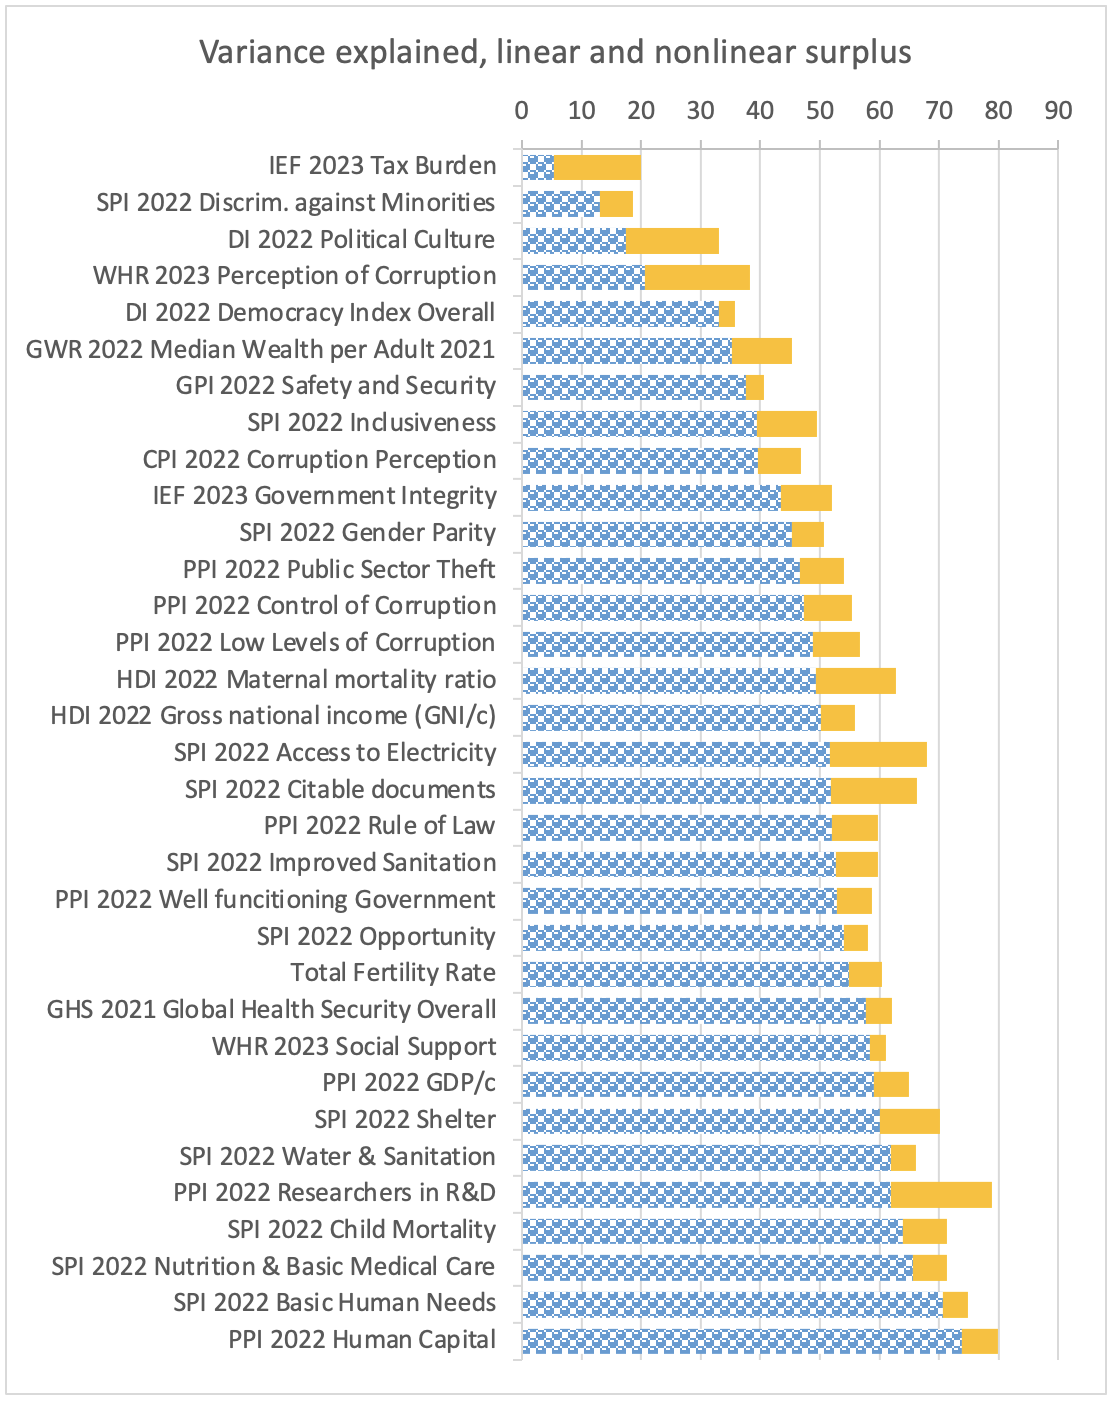
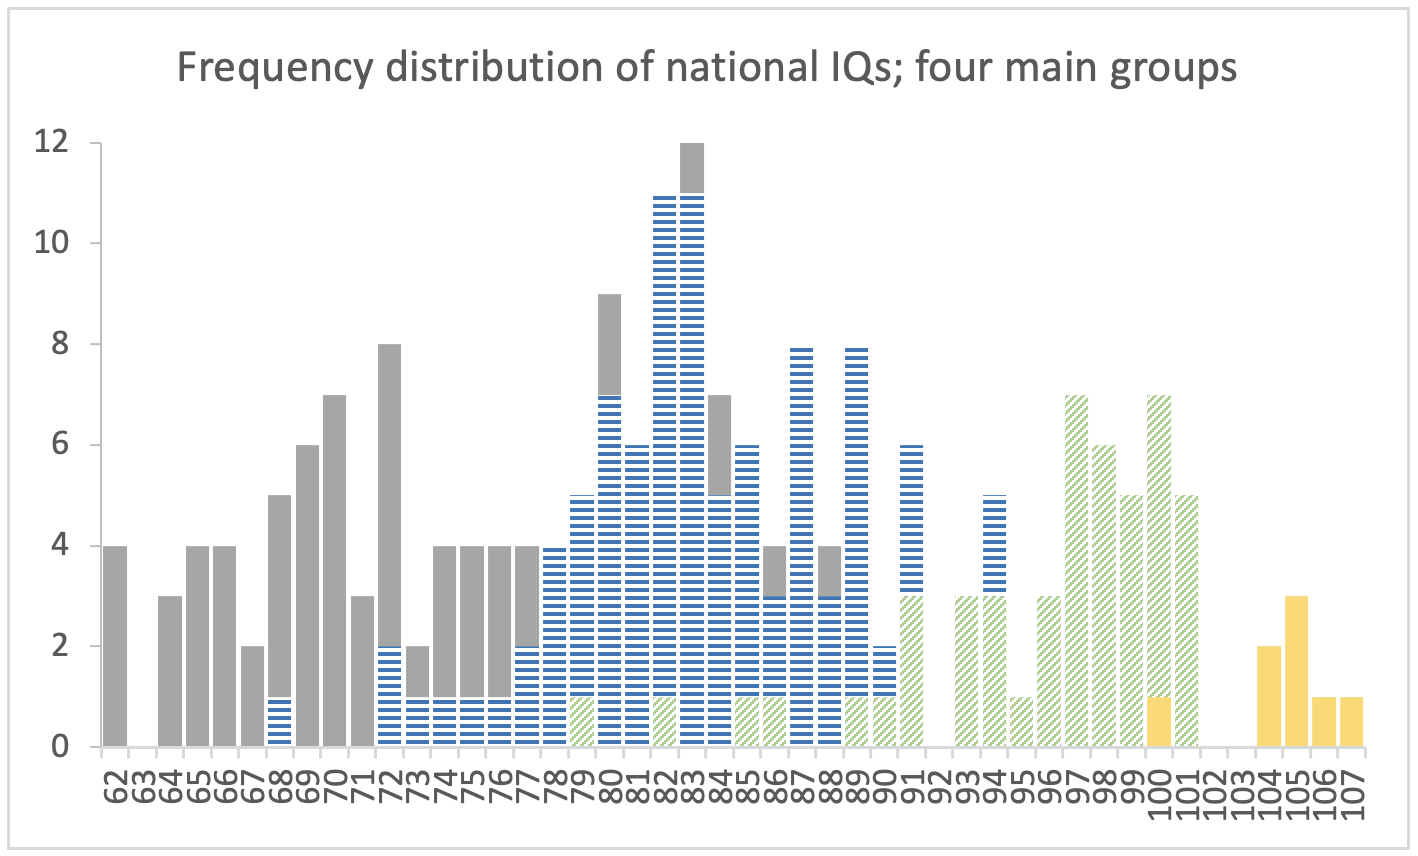
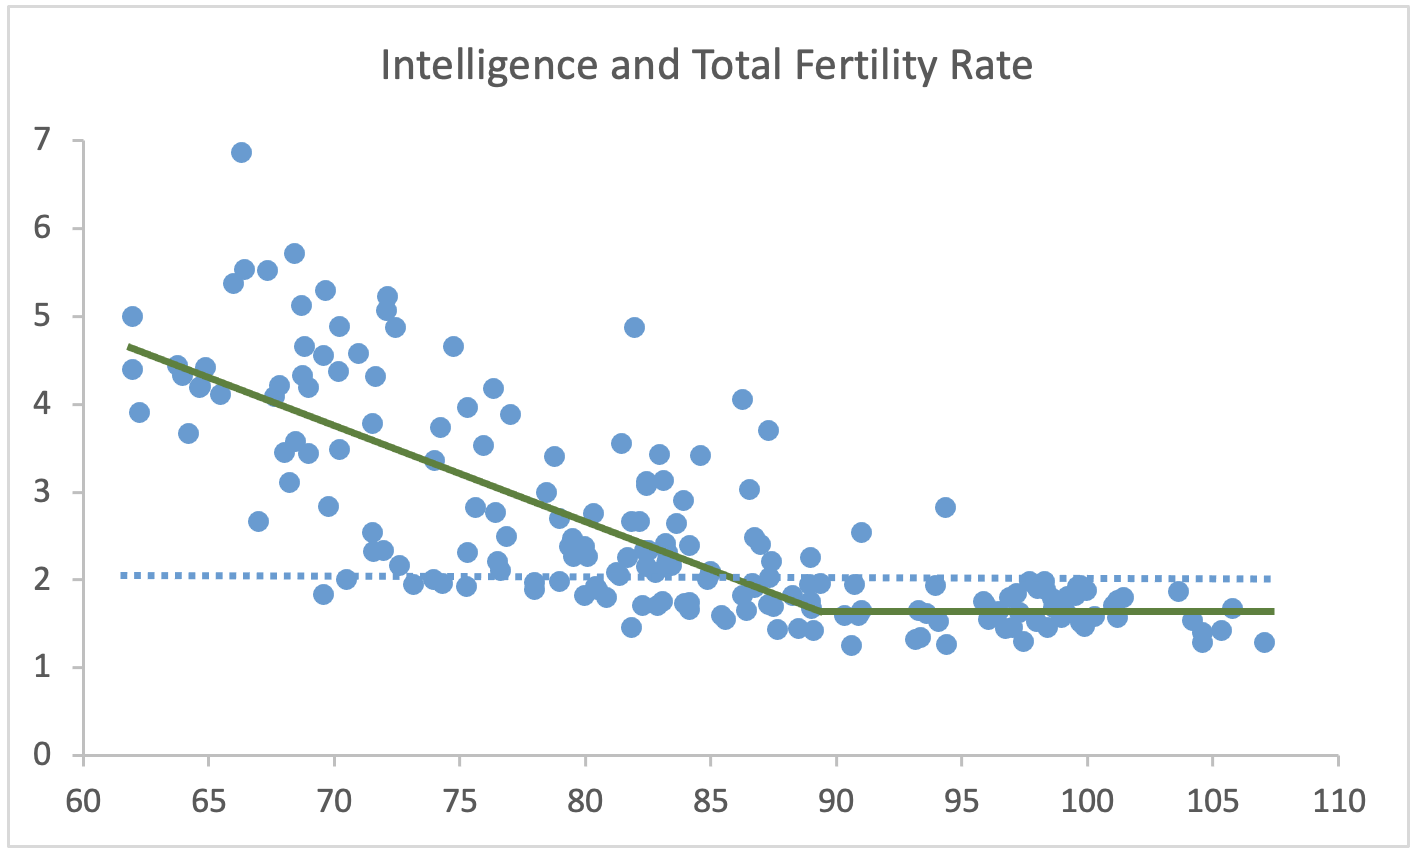
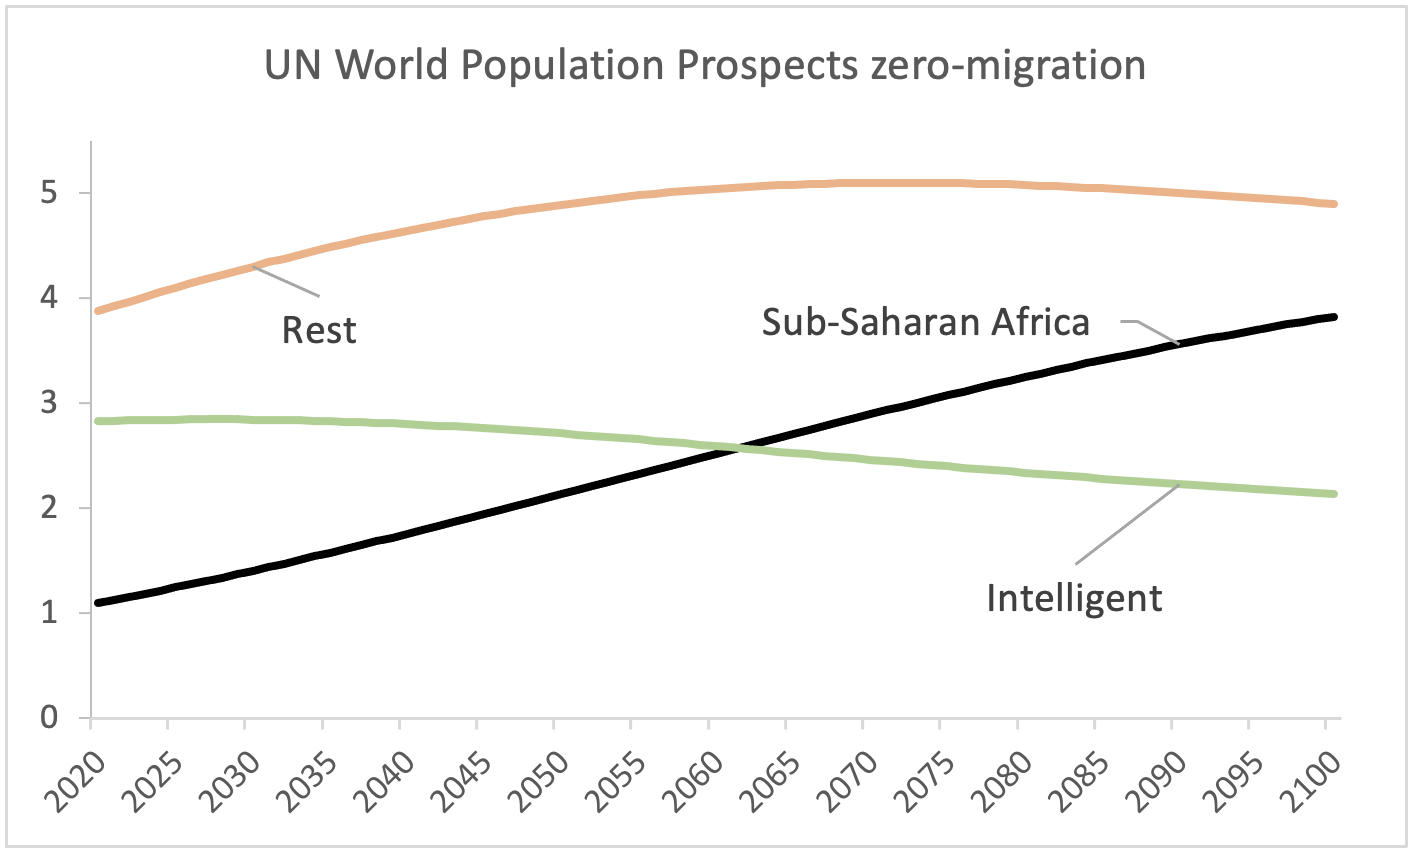

No hay comentarios:
Publicar un comentario